Rescale by Function (Spatial Analyst Tools)
Summary
Rescales the input raster values by applying a selected transformation function and transforming the resulting values onto a specified continuous evaluation scale.
Usage
The primary benefits of using this tool over other reclassification methods is the greater level of control over how the input values are reclassified as follows:
Accept and directly process continuous input values without requiring the values to be grouped into categories.
Linear and nonlinear continuous functions can be applied to the input data.
Rescale the input values onto a continuous floating-point evaluation scale.
Reviewing the essential vocabulary for this tool may help with understanding the explanations below.
Rescaling input data on a continuous scale is conceptually a two-step process as follows:
Apply the specified function to the input raster values.
Linearly transform the function values to a specified evaluation scale. In an ascending evaluation scale, the minimum and maximum function values are set to the specified minimum (From scale) and maximum (To scale) of the evaluation scale, respectively. However, the evaluation scale can also be reversed for a descending scale.
The following illustration shows an example of a Power function graph to introduce the general concepts and terminology associated with applying a transformation function:
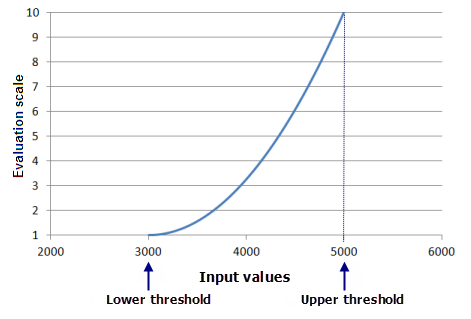
An example plot of the Power function, with a value of 2 for the exponent and an evaluation scale of 1 to 10 is shown. The input data range for this example is from 3,000 to 5,000. The lowest value in the input raster is set to the Lower threshold value and the highest to the Upper threshold (seen on the x-axis), with the Power function being constrained (fit) between the thresholds. Shape-controlling parameters define the shape of the function—such as Input shift and Exponent for the Power function—allowing you to control where the function begins and how steeply it will rise. The resulting function values from the Power function are then linearly transformed to the evaluation scale to assign the output values. In the graph above, a 1 to 10 evaluation scale has been defined using the From scale and To scale parameters, as can be seen on the y-axis.
By default, the minimum value from the Input raster parameter is assigned to the Lower threshold value, and the maximum value is assigned to the Upper threshold value.
By default, the specified function is constrained (fit) between the lower and upper thresholds, if possible, using the Input raster values. How the function is fit between the lower and upper thresholds varies based on the particular transformation function being used in the following ways:
Linear and Symmetrical Linear functions, by definition, are fitted since the minimum and maximum of the functions are set to the minimum (the lower threshold) and maximum (the upper threshold) of the Input raster parameter value.
A fitted version of the Exponential and Logarithm functions is applied to the values from the Input raster parameter.
As many of the parameters as possible are derived from the Input raster value (for example, Midpoint, Factor, and Input shift) to obtain the best fit for Gaussian, Near, Small, MS Small, Large, MS Large, Power, Logistic Growth, and Logistic Decay functions.
When the Lower threshold and Upper threshold values are altered, the following interactions apply:
If an input cell has a value lower than the Lower threshold value, it will be assigned to the value set in the Value below threshold parameter.
If an input cell has a value greater than the Upper threshold value, it will be assigned to the value set in the Value above threshold parameter.
All cell values, including and between the Lower threshold and Upper threshold values, will be assigned to the corresponding evaluation scale based on the function value, f(x). In certain cases, when a shape-controlling parameter (for example, Spread or Exponent) is altered, the output raster may not have any cells assigned to the From scale or To scale values.
By default, the parameters defining the shape of the function (for example, Spread or Base factor) will be calculated to best fit (constrain) the function to the minimum and maximum of the Input raster values. However, the shape-controlling parameters can be altered to refine the fit of the function to the preference interaction of the phenomenon to the criterion values. When a value is specified for any shape-controlling parameter, the resulting function, in conjunction with the lower and upper thresholds, will be used in rescaling the Input raster values; the fitted version on the function will not be used.
The From scale and To scale parameters define the upper and lower values of the continuous evaluation scale. The smallest function value is assigned to the value set for From scale, and the largest function value is assigned to the value set for To scale. All function values in between are assigned to the appropriate evaluation values.
The evaluation scale can be set to range from low to high (for example, 1 to 10) or from high to low (for example, 10 to 1).
The Value below threshold and Value above threshold values are assigned to all cells that have an input value below and above the thresholds, respectively. These values are assigned directly to the final output raster, and these cells are not considered in the processing of the transformation function.
On the tool dialog box, generally when the Lower threshold or Upper threshold parameter value is altered, the shape-controlling parameters—parameters defining the shape of the function, for example, Spread or Base factor—are automatically recalculated. However, when a shape-controlling parameter is altered, the Lower threshold and Upper threshold values will not change automatically, and if the Lower threshold or Upper threshold value is subsequently changed, the altered shape-controlling parameter (and any other associated shape-controlling parameters) will retain the changed setting and it will not be recalculated.
The shape-controlling parameters for the function (for example, Spread or Base factor) and the lower and upper thresholds are based on statistics calculated for the current processing extent, cell size, and snap raster environment settings. If none of these are set, the statistics associated with the full extent of the input raster are used.
On the tool dialog box, if the input raster does not have valid statistics to calculate the shape-controlling parameters or to determine the thresholds, these parameters will be empty and you will receive a warning message. You will need to click the Calculate Statistics button to recalculate statistics to the current environment settings to populate the parameters. The Lower threshold value will default to the minimum value within the processing extent. and the Upper threshold value will default to the maximum value, with the shape-controlling parameter values appropriately determined. You may not have valid statistics for the following conditions:
The environment processing extent, cell size, or snap raster is set before opening the tool dialog box.
The input raster does not have statistics.
On the tool dialog box, if the environment processing extent, cell size, or snap raster is changed after an input raster is provided and a function has been specified, the function parameters may be set to empty (no value in the parameter). Click the Calculate Statistics button to repopulate the parameters to view the values for the new extent. If the Lower threshold, Upper threshold, or any shape-controlling parameters are changed by providing a value, the tool will track that these parameters have been altered. If the processing extent is changed, the values for these parameters will remain as specified after clicking the Calculate Statistics button.
Multiple functions can be applied to different ranges of the input raster. To do so, the functions can be concatenated by running this tool multiple times. First specify a transformation function for a certain range of the input values; then run it again, applying another function to a different range of the values. The resulting output rasters are then combined. The following workflow is an example:
Run Rescale by Function, applying a linear function to the input values from 1,500 to 3,200, and set the values above and below the thresholds to 0.
Run the tool again on the same input raster, this time, applying an Exponential function to the values greater than 3,200 and up to 5,000, and set the values above and below the thresholds to 0.
Add the two resulting output rasters together using the Plus tool.
See Analysis environments and Spatial Analyst for additional details on the geoprocessing environments that apply to this tool.
Parameters
| Label | Explanation | Data type |
|---|---|---|
|
Input raster |
The input raster that will be rescaled. |
Raster Layer |
|
Transformation function (Optional) |
Specifies the continuous function that will be used to transform the values from the input raster. The transformation functions are used to specify the function that will rescale the input data. A general description of each function and the default values for the functions are detailed in the entries below.
The default transformation is MS Small. |
Transformation function |
|
From scale (Optional) |
The starting value of the output evaluation scale. This value cannot be equal to the To scale value. It can be lower or higher than the To scale value (for example, from 1 to 10, or from 10 to 1). The value must be positive and it can be either an integer or double. The default is 1. |
Double |
|
To scale (Optional) |
The ending value of the output evaluation scale. This value cannot be equal to the From scale value. It can be lower or higher than the From scale value (for example, from 1 to 10, or from 10 to 1). The value must be positive and it can be either an integer or double. The default is 10. |
Double |
Return value
| Label | Explanation | Data type |
|---|---|---|
|
Output raster |
The output rescaled raster. The output will be a floating-point raster with values ranging from (or within) the From scale and To scale evaluation values. |
Raster |
Environments
Auto Commit, Cell Size, Cell Size Projection Method, Current Workspace, Extent, Geographic Transformations, Mask, Output CONFIG Keyword, Output Coordinate System, Scratch Workspace, Snap Raster, Tile Size
Licensing information
- Basic: Requires Spatial Analyst
- Standard: Requires Spatial Analyst
- Advanced: Requires Spatial Analyst
Related topics
- An overview of the Reclass toolset
- Find a geoprocessing tool
- Understanding reclassification
- How Rescale by Function works
- The transformation functions available for Rescale by Function
- The interaction of the lower and upper thresholds on the output values for Rescale by Function
- Formulas for the transformation functions