Share a web tool
You can share custom geoprocessing tools you create from ModelBuilder models or Python scripts to your ArcGIS Enterprise portal. Unlike a tool shared with a geoprocessing package, a web tool is hosted on—and runs in—your portal server or a server federated with your portal. You can access web tools in ArcGIS Pro and Map Viewer, as well as custom web apps such as those built with ArcGIS Experience Builder.
Overview
- This video was created with ArcGIS Pro 3.6.
In this tutorial, you'll share an existing geoprocessing model as a web tool and run it in your portal from ArcGIS Pro. The model summarizes the amount of a specified invasive grass species near locations where people may come in contact with the grass and accidentally spread it. The model is essentially the same one that you build in the Make a geoprocessing model quick-start tutorial. Completing that tutorial first is not required, but is helpful if you aren't familiar with geoprocessing models or if you want a better understanding of how the model works.
Suppose that your organization plans to partner with the regional government in the Marlborough region of New Zealand to increase monitoring of invasive grasses, such as Nassella tussock and Chilean needle grass. A website will allow concerned residents to submit an address or spatial coordinates for analysis. Members of your team can then run the web tool to determine how much invasive grass is nearby.
Estimated time: 45 minutes
Software requirements:
ArcGIS Pro Basic
Membership in an ArcGIS Enterprise organization with an administrator role or a custom role that includes the privilege to publish web tools
ArcGIS Enterprise 12.1 or a later version
Note:
It is recommended that you use equivalent versions of ArcGIS Enterprise and ArcGIS Pro. Using versions that are not equivalent can result in warnings, errors, or unexpected behavior.
Note:
The quick-start tutorials are updated at each software release. For the best experience, use an online help version that matches your software version.
Download the data and open the project
You need access to a web browser to download the project data. To download the data and open the project, complete the following steps:
Go to the Share a web tool v370 overview page on ArcGIS Online.
Click Download.
In the Downloads folder on your computer, double-click
Share_a_web_tool_v370.ppkxto start ArcGIS Pro and open the project.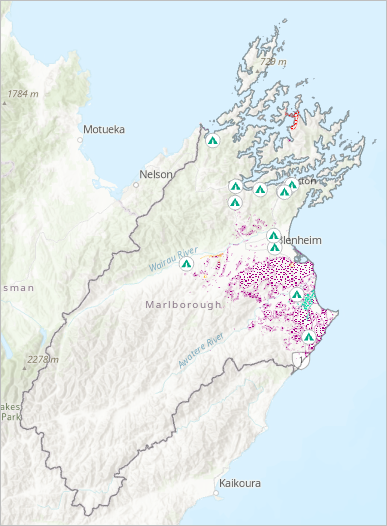
The project opens with a map view of the Marlborough region of New Zealand. Layers representing invasive grasses and contact locations are present in the Contents pane.
Run the model as a geoprocessing tool
Before you share a tool to the web, you must run it in an ArcGIS Pro project. This ensures that the tool can access its input data and that it runs successfully. To understand what the tool does, you'll look at it in a ModelBuilder view.
On the ribbon, click the View tab. In the Windows group, click Pane Sets
 and click Mapping
  .
.This ensures that the Contents and Catalog panes are open and that other panes are closed.
Make the Catalog pane active. On the Project tab, expand Toolboxes
 and expand the Share_a_web_tool toolbox. Right-click the Summarize Invasive Species model and click Edit.
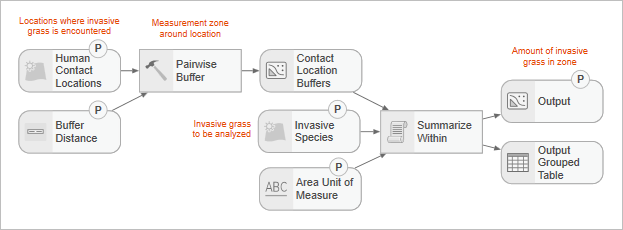
The model opens in a view.
Tip:
If you don't see the full model in the view, click Fit to Window
 in the status bar at the bottom of the view.
As input, the model takes contact locations such as campgrounds or hiking trails where people may encounter invasive grasses. A buffer distance around the location is specified and an invasive grass species is chosen. The model calculates the amount of invasive grass in the buffer zone (or zones, if there are multiple input features) and creates an output feature class with the results.
Note:
Tools can be built-in tools
 , model tools
  , or script tools
  . See Geoprocessing vocabulary for more information.
In the model, hover over the element representing the Pairwise Buffer tool to see its parameters.
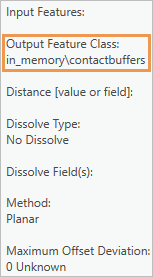
The output from the Pairwise Buffer tool is intermediate data used only as input to the Summarize Within tool. For this reason, it is not written to disk but to a memory workspace. This improves the tool performance and is important when you author web tools with ModelBuilder.
Close the Summarize Invasive Species view by clicking Close
 on its tab. If you adjusted the view, click Yes on the prompt to save changes.
Before you can share the model as a web tool, you must run it as a local geoprocessing tool to make sure it doesn't contain errors.
In the Catalog pane, right-click Summarize Invasive Species and click Open.
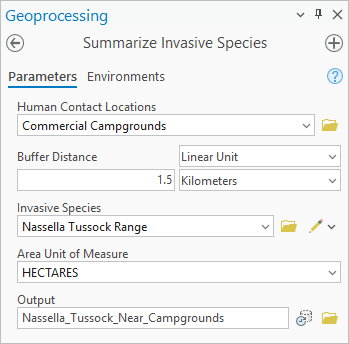
The tool opens in the Geoprocessing pane. At the top of the pane, the Parameters tab is selected.
Click the Human Contact Locations parameter drop-down arrow and click Commercial Campgrounds.
For Buffer Distance, type 1.5. Change the units from Unknown to Kilometers.
Click the Invasive Species drop-down arrow and click Nassella Tussock Range.
Click the Area Unit of Measure drop-down arrow and click HECTARES.
In the Output box, type Nassella_Tussock_Near_Campgrounds.
The output feature class will be created in the project's default geodatabase.
Click Run
 .
.When the tool finishes, a completion message appears at the bottom of the Geoprocessing pane and a layer is added to the Contents pane.
The new Nassella_Tussock_Near_Campgrounds layer is symbolized with a black outline and hollow fill. At the present map scale, the features may be obscured by the Commercial Campgrounds symbols.
Zoom in on the map to see the buffer features around the campgrounds.
In the Contents pane, right-click the Nassella_Tussock_Near_Campgrounds layer and click Attribute Table
 .
.The table contains a record for each campground.
In the table, right-click the
Summarized area in HECTARESfield heading and click Sort Descending .
.Four campgrounds contain Nassella Tussock within a 1.5-kilometer radius.
Close the table.
In the Contents pane, right-click the Nassella_Tussock_Near_Campgrounds layer and click Remove
 .
.Make the Catalog pane active. On the Project tab, expand the Databases container
 and expand model_output.gdb.
The geodatabase contains a feature class named Nassella_Tussock_Near_Campgrounds. This is the output data created by the tool.
On the Quick Access Toolbar, click Save Project
 .
.
Configure the web tool
Now that the tool has run successfully, you can configure it as a web tool. You'll share it with your organization so that your colleagues can access it from ArcGIS Pro and other client apps. Hosting the web tool in your portal makes it accessible throughout your organization.
On the ribbon, click the Share tab. In the Share As group, click the Web Tool drop-down arrow and click Share Web Tool
 .
.Note:
This command is unavailable if you are not currently signed in to an ArcGIS Enterprise portal. You may need to manage your portal connections.
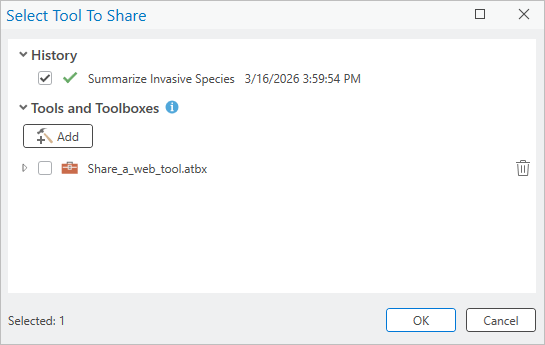
In the Select Tool To Share window, check the Summarize Invasive Species check box.
Note:
It is recommended to run your tool before publishing to ensure it functions as intended and does not contain any errors. You can publish tools without running them first, but this is recommended only for tools that cannot be run locally, such as those that use hardcoded data paths that are only accessible to ArcGIS Server.
Click OK.
The Share As Web Tool pane appears.
Tip:
You can also open the pane with these steps:
On the ribbon, click the Analysis tab.
In the Geoprocessing group, click History
 .
.In the History pane, right-click the Summarize Invasive Species entry, click Share As, and click Share Web Tool
.
If an error message appears at the top of the pane, your account may not have the privilege to share web tools. See the software requirements for this tutorial above.
On the General tab, under Item Details, the Name, Summary, and Tags boxes are populated with metadata that was previously created for the tool.
Under Data, next to Non-URL Data, hover over the information icon
 and read the message that appears.
Tip:
While the message is displayed, you can press the F1 key to learn more about this setting.
Under Non-URL Data, click Copy all data.
The invasive grass datasets are authoritative data that must be used with the tool. Because this data is not registered with the server, it will be copied to the server when you share the web tool. Strictly speaking, you don't need to change the default setting because unregistered data is copied with either option. However, the Copy all data option describes the actual behavior clearly.
Under Data, next to URL Data, hover over the information icon
and read the message that appears.This project doesn't use URL data. The default setting can be left as is.
Under Location, accept the default settings.
The web tool will be saved to the root level of My Content
 in your ArcGIS Enterprise portal.
Under Sharing Level, click Organization.
All members of the organization who can create content will be able to run the web tool.
At the top of the pane, click the Configuration tab.
In this tutorial, you will use the default settings.
Click the Content tab.
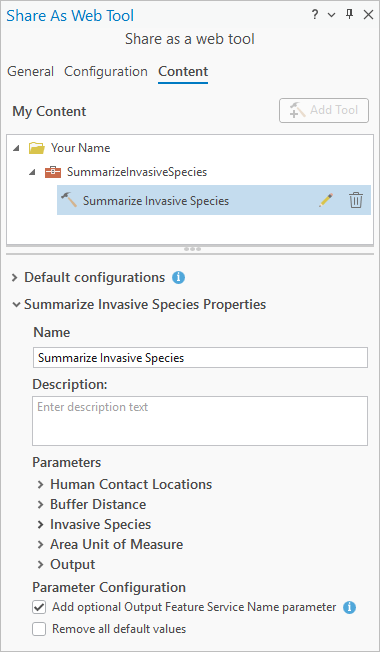
In the top part of the pane, you see the folder in My Content where the web tool will be stored on your portal. In the bottom part of the pane are tool properties you can configure.
In the bottom part of the pane, in the Description text box, type (or copy and paste) the following text: Finds and summarizes invasive species within a buffer zone of designated locations.
Under Parameters, expand Human Contact Locations.
The parameter description comes from the geoprocessing tool metadata.
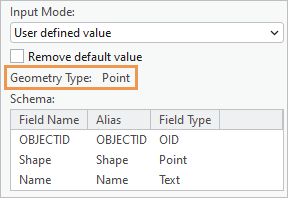
Click the Input Mode drop-down arrow and click User defined value.
The plan is for concerned citizens to submit locations to analyze, so the value must be user-defined, rather than coming from a predefined list.
Under the input mode setting, the geometry type defaults to Point. This is because you used a point layer (Commercial Campgrounds) for the contact locations when you ran the tool in the previous section. You also see the table schema that will be used for interactively created point layers. This is the schema of the Commercial Campgrounds layer.
When web tool users add locations to analyze with the interactive input button
 , they will create point features by default. Other geometry types—line, polygon, and multipatch—will be available from a drop-down list. Considering this tool's intended use, users will always create points.
Tip:
You can restrict the types of geometry that will be available as interactive input in the web tool by placing a parameter filter on the appropriate model parameter before you run the model as a tool. In this case, you would place a feature type filter on the Human Contact Locations parameter and set its value to Point. To do this, edit the model and open the model properties. On the Tool Properties dialog box, click the Parameters tab and click in the Filter column.
Expand the Buffer Distance parameter.
By default, the input mode for this parameter is set to User defined value. The default value is 1.5 kilometers—the setting you used when you ran the tool. The web tool user can change this value, but you will leave the default in place.
Expand the Invasive Species parameter.
The default input mode is Choice list. The web tool user should be able to choose an invasive grass species to analyze, but no other layers should be available. The data for the layers you select in the choice list will be copied to the server.
In the list of layers, uncheck the check boxes for the following layers:
Commercial Campgrounds
Campsites
Trails
Roads
Populated Places
Region
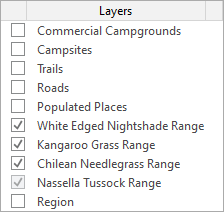
Leave the check boxes checked for the four invasive grass types. (The check box for Nassella Tussock Range can't be unchecked).
Expand the Area Unit of Measure parameter.
For consistent reporting, your organization will use hectares as the unit of measure for all invasive grass analysis. You don't want tool users to choose anything else.
Click the Input Mode drop-down arrow and click Constant value.
The constant value is automatically set to hectares, the unit of measure you chose when you ran the tool. Users will not see this parameter on the web tool.
Expand the Output parameter. In the Name box, replace the default name with Invasive Grass Summary.
This is the name of the output layer that is created when the web tool runs. (It is not actually the name of the output feature class stored in the project's default geodatabase.)
In the Description text box, type (or copy and paste) the following text: The name of the output layer that is created when the web tool runs.
Under Parameter Configuration, accept the default values. Leave the Add optional Output Feature Service Name parameter check box checked.
When the check box is checked, this parameter appears on the web tool. It allows the web tool user to write the analysis results to a feature service in the portal as well as to a local file geodatabase.
Learn more about using web tools with an output feature service
Share the web tool
You'll analyze the tool for warnings or errors and share it to your portal.
At the bottom of the pane, under Finish Sharing, click Analyze.
A Messages tab at the top of the pane displays warnings and errors. There are four grouped warnings.
Note:
If your ArcGIS Enterprise and ArcGIS Pro versions are not equivalent, you may see additional warnings. It is recommended that you use equivalent versions whenever possible, but for the purposes of this tutorial, you can ignore the warnings.
Expand the group and hover over one of the warnings.
The warning informs you (as you already know) that the data source is not registered and will be copied to the server. The same warning appears for each invasive grass type. With large datasets, copying data to the server may slow down the sharing process. In this case, the datasets are small and will be copied quickly.
Tip:
When you hover over a warning or error message, click Options
 to take corrective action or to open a relevant help topic.
Click Publish.
When the tool is successfully shared to your portal, a message appears at the bottom of the pane.
Note:
If a web tool with the same name already exists in your portal, you'll get a publishing error. Click OK on the error message. In the Share As Web Tool pane, click the General tab. In the Name box, edit the tool name (don't include spaces). At the bottom of the pane, click Publish again.
On the success message, click Manage the web tool to open a web browser to your ArcGIS Enterprise portal. Sign in if prompted.
The web tool's item page appears. You can come back at a later time to add more metadata and a thumbnail image to the item page.
At the top of the site, click Content.
Close the browser tab or window that displays your portal content.
In the next section, you'll open the web tool from ArcGIS Pro and create a feature to analyze for proximity to Nassella Tussock.
Open the web tool and create a feature to analyze
You'll open the web tool, create an editable layer, and add a point feature at a location to analyze. This simulates your intended use case: a concerned resident wants to find out about invasive grass near a home or business.
In ArcGIS Pro, make the Catalog pane active. Click the Portal tab at the top of the pane.
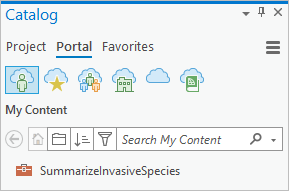
The SummarizeInvasiveSpecies web tool item appears on the My Content tab
.Note:
For other members of your organization, the tool appears on the My Organization tab
 . It can also be found on the ArcGIS Enterprise tab
  .
.Double-click the SummarizeInvasiveSpecies web tool item and double-click the Summarize Invasive Species web tool.
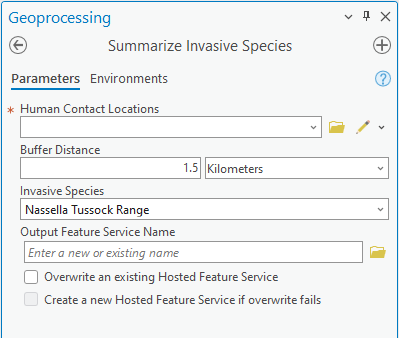
The tool opens in the Geoprocessing pane. The Buffer Distance and Invasive Species parameters are set by default. The settings can be changed, but you'll accept them for now. Notice that the tool does not display parameters for the measurement units or the output feature class. You have the option to create an output feature service—if you have a publisher role—but you won't do that in this tutorial.
For the Human Contact Locations parameter, you can provide input data in various ways. You can choose a layer from the current map, browse to a dataset or web feature layer, or create features interactively in a new feature class. For your tool's purpose, interactive input is the most suitable method.
Next to Human Contact Locations, click the interactive input button
. Click the button, not the drop-down arrow.An editable layer is added to the Contents pane. In the Geoprocessing pane, a feature template appears, and the construction toolbar appears on the map. In addition, a point feature class is created in your default geodatabase.
Before you add a location interactively, you'll rename the layer and choose a different symbol.
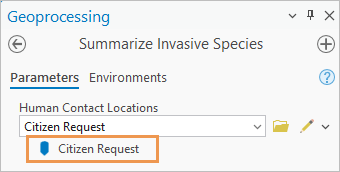
In the Contents pane, click the Summarize_Invasive_Species_Human_Contact_Locations_Points layer once to make its name editable. Type Citizen Request and press the Enter key.
Under the new layer name, click its default symbol.
The Symbology pane appears and presents point symbol formatting options.
At the top of the pane, ensure the Gallery tab is selected. In the search box, type Esri Pin and press the Enter key.
In the list of results, click the medium-sized Esri Pin 1 symbol.
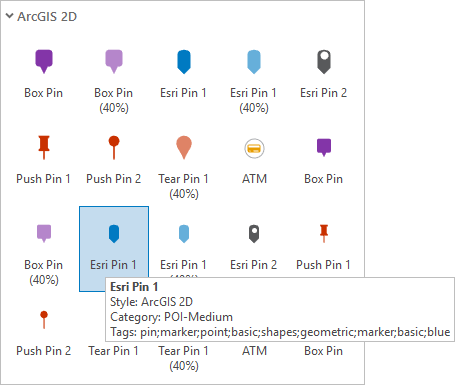
Note:
You may have fewer results if semantic search is not enabled.
The layer symbol is updated in the Contents pane.
To create a feature on the map, you'll open the feature editing template and choose an editing tool.
Make the Geoprocessing pane active. Under the Human Contact Locations parameter, click Citizen Request.
The feature editing template expands. The Point
 tool is selected by default.
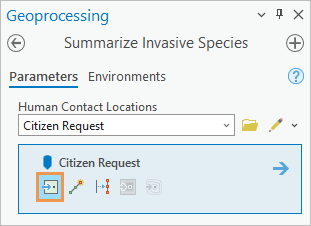
Suppose that you have been contacted by a vineyard owner who thinks she has seen Nassella Tussock near her property.
On the ribbon, click the Map tab. In the Inquiry group, click Locate
 .
.The Locate pane appears. In the pane, the Locate tab is selected.
In the Locate pane, click Options
 and confirm that ArcGIS World Geocoding Service or another locate provider is available and enabled.
If the only provider is XY Provider, use spatial coordinates instead of a street address in the next step.
Click in the search box. Type (or copy and paste) New Zealand State Highway 6 and Rapaura Road, Renwick, 7273 and press the Enter key. Alternatively, enter these coordinates in the search box: 173.8170288°E 41.4865202°S.
The map zooms to the location and a temporary marker is placed at the street intersection.
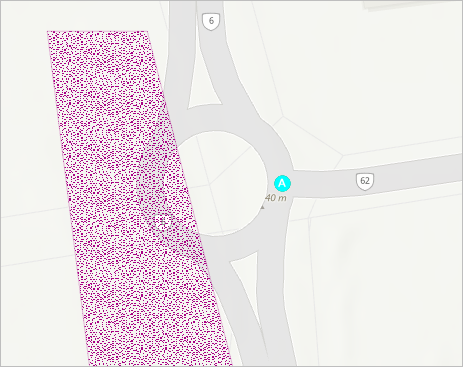
Hover over the location and click to create a point feature in the Citizen Request layer.
The new feature is saved automatically.
On the editing toolbar near the bottom of the map, click Finish
 .
.In the Locate pane, in the search box, highlight the address (or coordinates) and press Ctrl+C to copy the text.
You'll add this information to the feature's record in the attribute table in the next section. Optionally, you can paste the text now to Microsoft Notepad or a handy text editor.
In the search box, click Delete
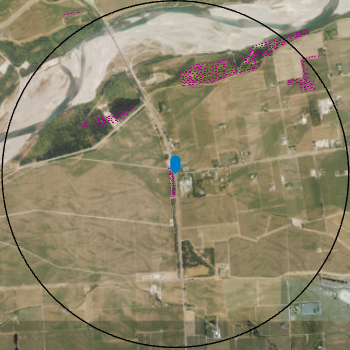
to clear the result and remove the temporary marker from the map.At the bottom of the map view, click the map scale drop-down arrow and click 1:10,000.
If this scale does not appear in your list of predefined scales, you can type it in the scale box.
In the Contents pane, turn on the World Imagery (Clarity) layer.
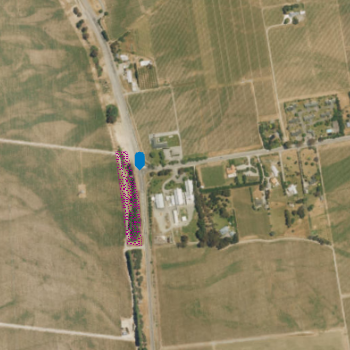
There are buildings in the vicinity and some patches of Nassella Tussock. You are ready to run the web tool and analyze the location.
Run the web tool
You'll run the web tool to create a buffer around the location and summarize the amount of Nassella Tussock inside it.
Keep in mind that the invasive grass features do not represent complete coverage of an area, but rather boundaries within which patches of invasive grass have been found. Some areas are more densely infested than others. Calculations of the amount of an invasive grass within a buffer zone are approximate.
Make the Geoprocessing pane
 active and confirm that the Human Contact Locations parameter is set to the Citizen Request layer.
Click Run
.When the operation finishes, a message appears at the bottom of the Geoprocessing pane. In the Contents pane, a layer named Invasive Grass Summary is added to the map.
In the Contents pane, right-click the Invasive Grass Summary layer and click Zoom To Layer
 .
.The map zooms to the extent of the 1.5-kilometer buffer.
In the Contents pane, right-click the Invasive Grass Summary layer and click Attribute Table
.In the table, the
Summarized area in HECTARESfield shows that about 20 hectares of Nassella Tussock are in the buffer zone.In the table, in the
Namefield, double-click the Null value cell to make it editable. Press Ctrl+V to paste the address (or coordinates) of the location you analyzed. Press the Enter key to commit the change.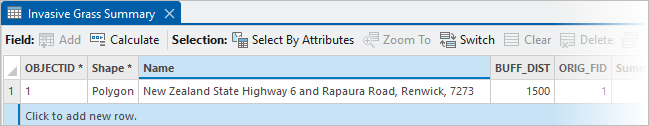
On the ribbon, click the Edit tab. In the Manage Edits group, click Save
 . On the Save Edits prompt, click Yes.
Close the attribute table.
Note:
Before running the web tool, you can create multiple input features interactively. Each feature will be buffered and summarized. You can also run the tool multiple times while continuing to add features interactively. Each time the tool runs, a new output feature class is created.
After you run the tool, you can add more features by clicking the interactive input button
. However, this overwrites the existing layer (Citizen Request) and its source dataset. To resume editing without overwriting the layer, you can create features in the Create Features pane.
View output data and geoprocessing history
The source datasets for the Citizen Request and Invasive Grass Summary layers are in the default model_output geodatabase. The analysis results are stored in the project's geoprocessing history.
Make the Catalog pane
 active. At the top of the pane, click the Project tab.
If necessary, expand the Databases container
and expand the model_output geodatabase.The geodatabase contains a feature class named
feature_set<number>. This is the data source of the Invasive Grass Summary layer. It also contains a feature class namedSummarize_Invasive_Species_Human_Contact_Locations_Points. This is the data source of the Citizen Request layer.On the ribbon, click the Analysis tab. In the Geoprocessing group, click History
.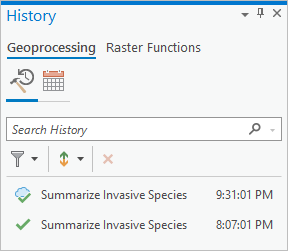
The History pane appears. It contains entries for your two successful geoprocessing operations: the web tool
 and the desktop tool
  . Hover over the entries to see details about each operation.
On the Quick Access Toolbar, click Save Project
.
Web tools work just like the custom script or model tools they are based on and produce the same results. They are readily available to users in your organization and can be shared publicly. You can overwrite a web tool if you need to modify it.
When you run a web tool, the geoprocessing is done on the portal server, not on your computer. The output data is returned from the server and written to the project's default geodatabase.
ArcGIS Pro isn’t the only client application that can run web tools. You can also use web tools in web apps such as Map Viewer.