Evaluate Bin Sizes for Point Aggregation (Spatial Statistics Tools)
Summary
Evaluates multiple bin sizes and recommends an appropriate bin size when aggregating points into a square or hexagonal grid. The tool can aggregate by counting point incidents or averaging the value of an analysis field in each bin. The tool also allows you to assess various other bin sizes to determine how the aggregation results and patterns would change.
The inputs to the tool are the points that will be aggregated, an optional analysis field, the bin type (hexagon or square), and an aggregation boundary polygons defining where points can occur (such as a city boundary for tree locations in a city). The outputs are the polygon bins along with charts to explore the results of various bin sizes.
Optionally, you can provide a time field and time interval to estimate a bin size when aggregating points into space-time bins.
Learn more about how Evaluate Bin Sizes for Point Aggregation works
Illustration
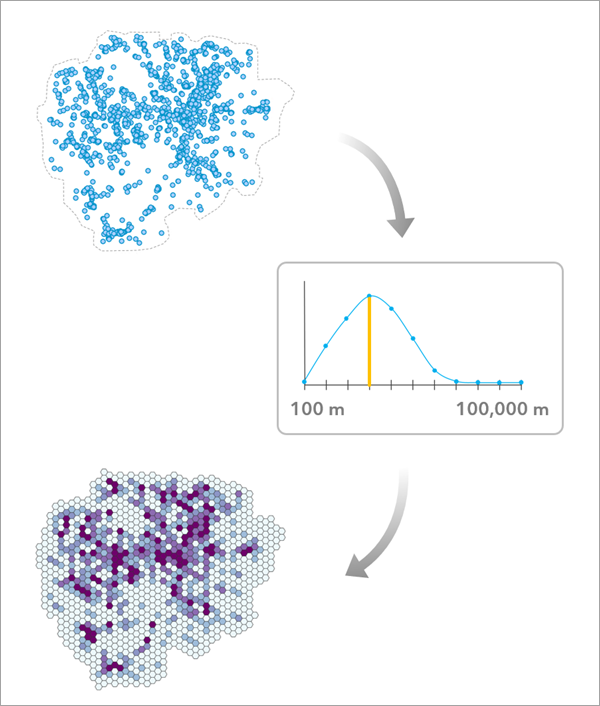
Usage
The tool evaluates each tested bin size by calculating two criteria: one that generally prefers small bin sizes and one that generally prefers large bin sizes. The two criteria are then combined to produce a final evaluation score for the bin size, and the larger the evaluation score, the better the bin size balances both criteria.
The Aggregation Boundary parameter is used to define the area in which points will be aggregated (sometimes called a study area) and should represent the area where it is possible for points to occur and be recorded. To estimate an appropriate bin size, it is important to differentiate between whether an area has no points because it happened to have no incidents (such as a section of a city having no robberies in a particular week) or whether it is not possible for points to be observed in the area (such as whale sightings on land).
When an analysis field is provided, the aggregation boundary is less important because bin means can only be calculated for bins containing at least one point. However, it is still recommended to provide a boundary that well represents the points.
The tool creates a group layer to hold the outputs of the tool. The outputs include the polygon bins using the recommended bin size, a table of evaluation scores along with charts, and the aggregation boundary polygon. The recommended bin size is also included as a derived output and is displayed in the messages.
The tool assumes that there is a single bin size that is appropriate for aggregating the points. However, in many cases, there is no single bin size that will adequately represent the points across the entire aggregation boundary. For example, in a large county that has rural areas with low population density and urban areas with high population density, it may be difficult to aggregate emergency calls across the entire county. Bins small enough to adequately represent the urban areas will be mostly empty in rural areas, while bins large enough for rural areas will condense urban centers into only a few bins. A common sign of this problem is very wide confidence intervals around the recommended bin size, indicating high uncertainty about which bin size to use. A potential solution is to separate the points into different datasets and aggregate them separately using different bin sizes.
You can aggregate points in space and time using the Time Field and Time Interval parameters. For example, for points representing emergency calls over the course of a year that you wish to aggregate each week, the tool will recommend a spatial bin size that is most appropriate to use for each week of the year. This is especially useful for aggregating points into a space-time cube.
Learn more about aggregating points in space and time
To create a space-time cube from the results of the tool, use the points as input to the Create Space Time Cube by Aggregating Points tool and provide the recommended bin size in the Distance Interval parameter. You must also use the same aggregation shape type (squares or hexagons) and provide the time interval in the Time Step Interval parameter.
Parameters
| Label | Explanation | Data type |
|---|---|---|
|
Input Point Features |
The input points that will be aggregated into bins. |
Feature Layer |
|
Output Feature Class |
The output polygon bins containing the count of points within each bin. |
Feature Class |
|
Output Evaluation Scores Table for Charts |
The output table that will contain the evaluation scores for all bin sizes. The table will come with charts showing the evaluation scores. |
Table |
|
Output Aggregation Boundary Polygons |
The aggregation boundary polygons that will be used to create the bins. |
Feature Class |
|
Bin Type (Optional) |
Specifies the shape of each bin.
|
String |
|
Aggregation Boundary (Optional) |
Specifies the boundary or study area in which the points will be aggregated into hexagonal or square bins, and bins will only be included in the output feature class if they intersect the aggregation boundary. The boundary should define the area where it is possible for points to occur. To estimate an appropriate bin size, it is important to differentiate between whether an area has no points because it happened to have no incidents (such as a section of a city having no robberies in a particular week) or whether it is not possible for points to occur in the area (such as whale sightings on land). Using an aggregation boundary that is too large (one that includes many areas where points are not possible or were not recorded) will often result in a bin size that is unrealistically large.
|
String |
|
Custom Polygons (Optional) |
The custom polygons that will be used as the aggregation boundary. |
Feature Layer |
|
Analysis Field (Optional) |
The numeric field that will be averaged within each bin. If no field is provided, the bins will contain the count of points in the bin. |
Field |
|
Combine Coincident Points (Optional) |
Specifies whether coincident points (points that are at the same location) will have their analysis field values averaged and treated as a single point.
|
Boolean |
|
Time Field (Optional) |
The field representing the time that the event occurred or the analysis field value was recorded. If provided, the points will be divided into time intervals. |
Field |
|
Time Interval (Optional) |
The time interval that will be used to divide the points into different time slices. The interval starts at the latest time of the points and works backwards. For example, if the latest time field value is December 15 at noon and the time interval is 5 days, then all points after December 10 at noon will be in the same time interval. Similarly, all points between December 5 at noon and December 10 at noon will be in the same time interval. All points in the same time interval will be treated as occurring at the same time. Points on the boundary between two time intervals will be included in the earlier interval. |
Time Unit |
Derived output
| Label | Explanation | Data type |
|---|---|---|
|
Output Bin Size |
The bin size with the largest evaluation score that is used to create the output feature class. The unit is the height of the bin (for squares, it is also the side length). |
Double |
|
Output Layer Group |
The output group layer that will contain the output features, output table, and output aggregation boundary polygons. |
Group Layer |
Environments
Extent, Output Coordinate System, Parallel Processing Factor, Random number generator
Licensing information
- Basic: Yes
- Standard: Yes
- Advanced: Yes