Target marketing reports reference
The Target Marketing workflow generates and automatically downloads reports you opted to create: Customer Demographic Profile report, Customer Tapestry Profile report, Developing Market Strategies report, Market Area and Gap Analysis report, and Market Potential report.
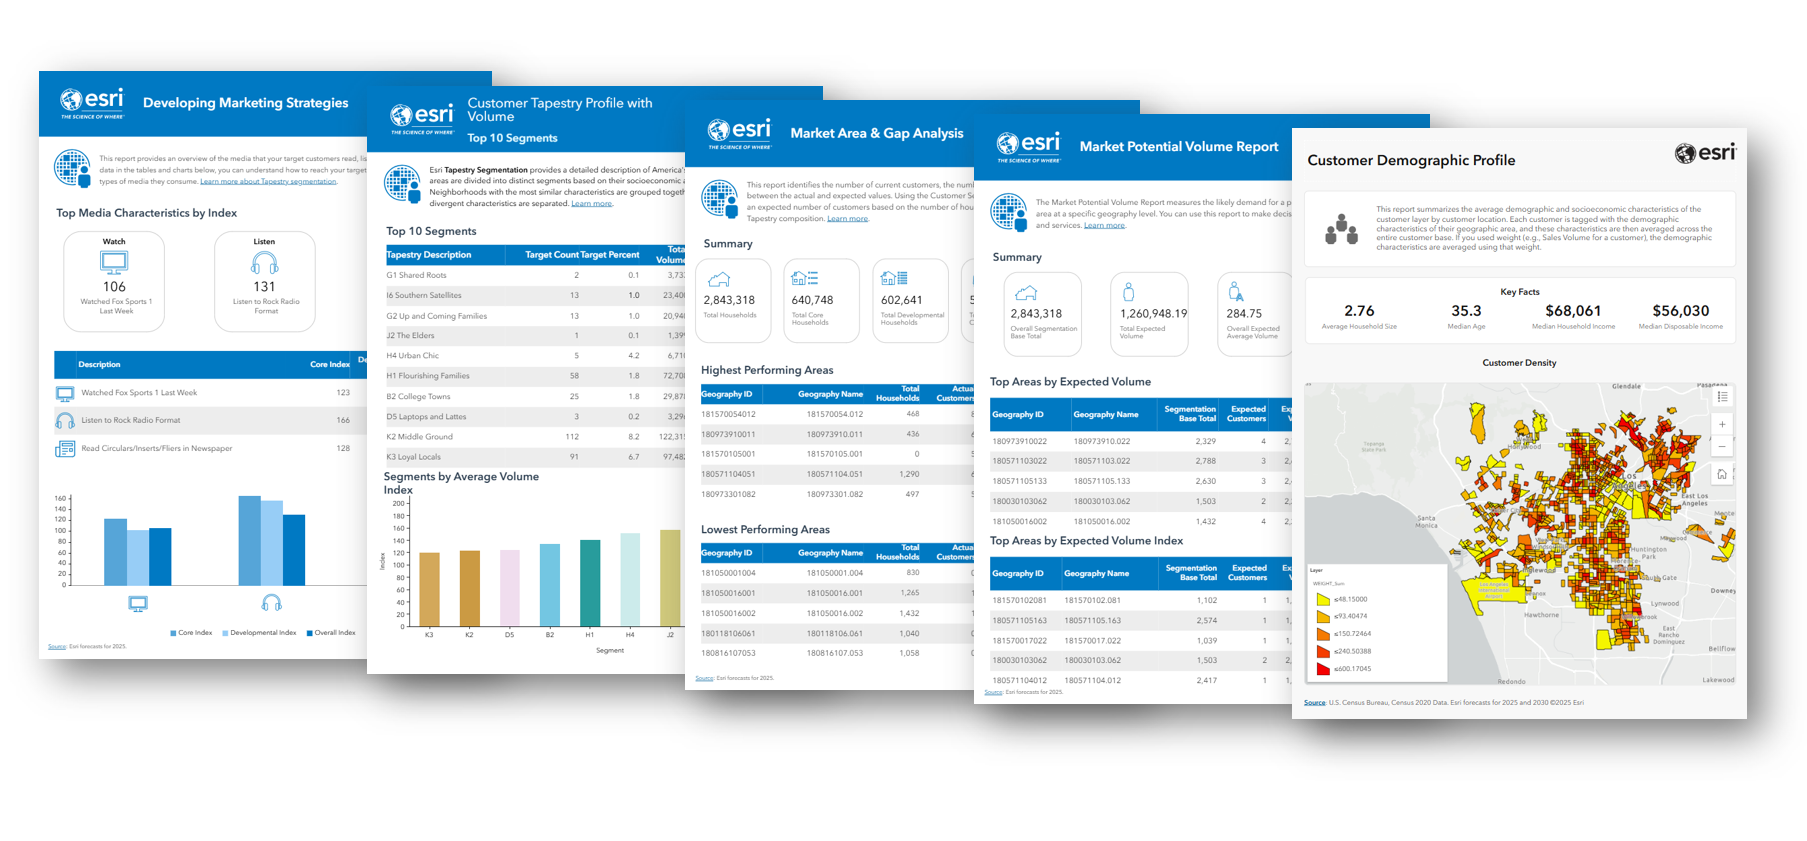
Depending on the data source you are using, the reports generated by the workflow may use a different segmentation system, such as PRIZM data in Canada. The report content may vary slightly.
Customer Demographic Profile report
This report summarizes demographic information to understand characteristics that could be considered common among customers in an area. Customer points are summarized using underlying polygon features (block groups by default) and based on the distribution of points (such as customer points), a demographic overview is created. The report is generated using the Generate Customer Demographic Profile Report geoprocessing tool.
Report samples
To view a sample report in HTML format, click a link below:
Customer Demographic Profile report (sample)
Report components
This report includes a range of variables and data as charts, tables, and indicators that provide context for the analysis. Each component is described below.
Key Facts indicators
These variables provide a general overview of the households in the market area. All variables are from the Esri Updated Demographics dataset.

|
Variable |
Description |
|---|---|
|
Average Household Size |
The average household size is calculated by dividing the number of persons living in households by the total number of households in the current year. Households include all the people who occupy a housing unit (such as a house or apartment) as their usual residence. |
|
Median Age |
Median age is calculated from the distribution of age by five-year groups. |
|
Median Household Income |
Median household income is the amount that divides household income (annual income for all household earners age 15+) into two equal groups in a geographic area: half of the population will have income higher than the median and half will have lower income. |
|
Median Disposable Income |
Disposable income represents money after taxes and provides an estimate of a household’s purchasing power. Median disposable income divides disposable income distribution into two equal groups: half the population has disposable income higher than the median, and half lower. |
Customer Density map
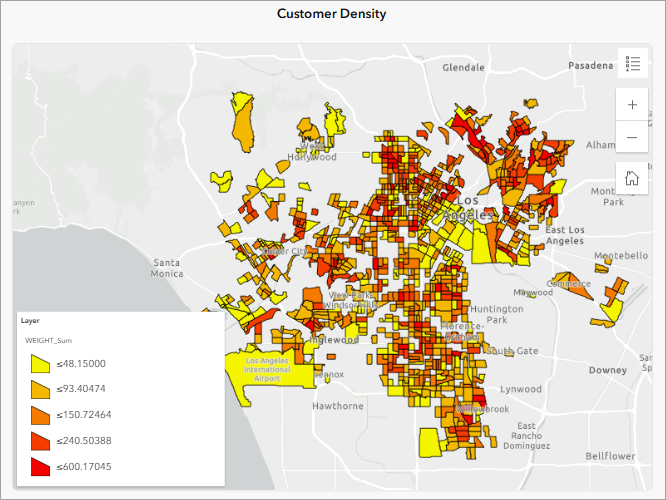
This map displays the density of either points or the volumetric field selected during creation of the customer profile. For example, it may show how many customers are in each ZIP code of the market area, or it may show how many store visits were made by customers in each ZIP code.
|
Calculation |
Description |
|---|---|
|
|
The number of customers in each geography on the map. This field is mapped when you have not specified a weight field, such as sales or store visits, in the customer layer. For example, a |
|
|
The amount of the weight field in each geography on the map. This field is mapped when you have specified a weight field, such as sales or store visits, in the customer layer. For example, if your customer layer includes a weight field measuring the number of store visits from your customers, a |
Demographic indicators (p. 2-3)
Pages two and three of the Customer Demographic Profile report include a number of indicators and charts that contain variable values for the weighted market area. The following variables are included:
All variables on page two are from the Esri Updated Demographics dataset.
|
Variable |
Description |
|---|---|
|
Median Household Income |
Median household income is the amount that divides household income (annual income for all household earners age 15+) into two equal groups in a geographic area: half of the population will have income higher than the median and half will have lower income. |
|
Per Capita Income |
Per Capita Income is calculated by dividing Aggregate Income by the Total Population for the area. |
|
Median Contract Rent |
Median Monthly Contract Rent divides contract rent with cash rent into two equal groups: half of the renter occupied housing units with paid rent will have a value higher than the median, and half lower. |
|
Percent of Income for Mortgage |
This is the median percentage of household income dedicated to mortgage payments for a home priced at the median value. |
|
Household Income |
Average Household Income is calculated by dividing the aggregate household income by the total number of households. Esri uses the U.S. Census definition of income; reference Esri Essential Vocabulary for more information. |
|
Population Age 25+: Grad/Professional Degree |
Esri estimate of the Population Age 25+ who earned a Graduate or Professional degree in the geographic area. |
|
Population Age 25+: Bachelor’s Degree |
Esri estimate of the Population Age 25+ who earned a Bachelor’s degree in the geographic area. |
|
Population Age 25+: Associate’s Degree |
Esri estimate of the Population Age 25+ who earned an Associate’s degree in the geographic area. |
|
Population Age 25+: High School Diploma |
Esri estimate of the Population Age 25+ who earned a high school diploma in the geographic area. |
|
Unemployed Population Age 16+ |
Esri estimate of the Unemployed Population Age 16+ in the geographic area. Unemployed Population includes those who are not on active duty in the Armed Forces, neither currently working nor waiting to work a job they hold, and have actively sought employment during the past four weeks and are available to work if hired; this includes temporarily laid off employees. |
|
White Collar Occupation |
Esri estimate of the Population age 16+ with Occupation: Management, Business/Financial, Computer/Mathematical, Architecture/Engineering, Life/Physical/Social Science, Community/Social Service, Legal, Education/Training/Library, Arts/Design/Entertainment/Sports/Media, Healthcare Practitioner/Technician, Sales and Sales related, or Office/Administrative Support in the geographic area. |
|
Services Occupation |
Esri estimate of the Population age 16+ with Occupation: Healthcare Support, Protective Service, Food Preparation/Serving Related, Building/Grounds Cleaning/Maintenance, or Personal Care/Service in the geographic area. |
|
Blue Collar Occupation |
Esri estimate of the Population age 16+ with Occupation: Farming/Fishing/Forestry, Construction/Extraction, Installation/Maintenance/Repair, Transportation/Material Moving, or Production in the geographic area. |
All variables on page three are from the Esri Consumer Spending dataset, unless otherwise noted. Esri’s Consumer Spending data provides information about the estimated spending by households for goods and services in an area. The average value represents the typical amount spent per household. The index value compares average local expenditures to U.S. levels. The index value for the U.S. is 100. If, for example, the index value for a geographic area is 80, this implies that average spending by consumers in the geographic area is likely to be 20 percent less than the U.S. average.
|
Variable |
Description |
|---|---|
|
Retail Trade (NAICS 44-45) Expenditures (Avg) |
Esri estimate of the average amount spent per household, within the Retail Trade (NAICS 44-45) NAICS Industry Sector in the geographic area. |
|
Average Disposable Income |
Esri estimate of Average Disposable Income in the geographic area. Average Disposable Income is calculated by dividing Aggregate Disposable Income by all households that have disposable income. Disposable Income represents money after taxes and provides an estimate of a household's purchasing power. Four types of taxes are deducted: federal individual income taxes, state individual income taxes, FICA (Social Security) and federal retirement payroll taxes, and property taxes for owner-occupied housing. Variable provided by Esri Updated Demographics. |
|
Spending: Housing (Avg and Index) |
Esri estimates of average amount spent per household and Spending Potential Index (SPI) on Housing in the geographic area. Includes expected spending on shelter, utilities, fuel, and public services. |
|
Spending: Food (Avg and Index) |
Esri estimates of average amount spent per household and Spending Potential Index (SPI) on Food in the geographic area. Includes expected spending on food at home or away from home. |
|
Spending: Healthcare (Avg and Index) |
Esri estimates of the average amount spent per household and Spending Potential Index (SPI) on Health Care in the geographic area. Includes expected spending on health insurance and medical care. |
|
Spending: Eating Out (Avg and Index) |
Esri estimates of the average amount spent per household and Spending Potential Index (SPI) on Food Away from Home in the geographic area. This includes expected spending on food and nonalcoholic beverages at restaurants/other, catered events, and school meals and board. |
|
Spending: Entertainment (Avg and Index) |
Esri estimates of the average amount spent per household and Spending Potential Index (SPI) on Entertainment/Recreation in the geographic area. This includes expected spending on live entertainment for catered events, rental of party supplies for catered events, entertainment/recreation fees and admissions, TV/video/audio, pets, toys/games/crafts/hobbies, recreational vehicles and fees, sports/rec/exercise equipment, photo equipment/supplies, and reading. |
|
Spending: Travel (Avg and Index) |
Esri estimates of the average amount spent per household and Spending Potential Index (SPI) on Travel in the geographic area. This includes expected spending on travel transportation costs, lodging on trips, vacation clubs, food and drink, and entertainment on trips. |
|
Spending: Apparel Products and Services (Avg and Index) |
Esri estimates of the average amount spent per household and Spending Potential Index (SPI) on Apparel Products & Services in the geographic area. This includes expected spending on shoe repair and other shoe services, apparel laundry and dry cleaning, alteration/repair/tailoring, clothing rental and storage, and watch and jewelry repair. |
|
Spending: Education (Avg and Index) |
Esri estimates of the average amount spent per household and Spending Potential Index (SPI) on Education in the geographic area. This includes expected spending on college, primary, secondary, and vocational school tuition and expenses, including finance/late/interest charges on student loans; school books and supplies; prepaid tuition; and test preparation and tutoring. |
Tapestry indicators (p.4)
Page four of the Customer Demographic Profile report includes an overview of the most common ArcGIS Tapestry segments in the market area. To learn more about ArcGIS Tapestry segments, visit the ArcGIS Tapestry help documentation.
Customer Tapestry Profile report
This report helps identify your target customers. It shows the segments and summary groups that most accurately reflect your customers and compares your customer profile to the market area profile using segmentation. Based on the optional volumetric parameter set during customer profile creation, this report can also be generated as a Customer Tapestry Profile with Volume report. The report is generated using the Generate Segmentation Profile Report geoprocessing tool.
Report samples
To view a sample report in HTML format, click a link below:
Customer Tapestry Profile report (sample)
Report components
This report includes tables and charts that provide context for the analysis. Each component is described below.
Top 10 Segments table
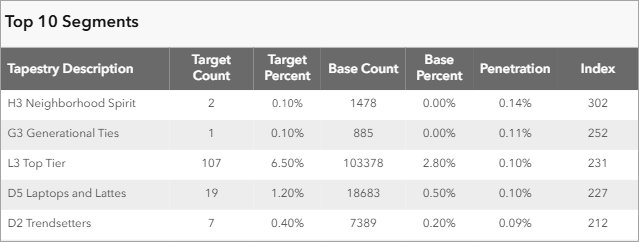
The Top 10 Segments table lists the most populous segments in the selected market area and provides statistics that compare their prevalence in the target group. When the report is created as HTML, this table can be filtered, sorted, and viewed as charts.
|
Statistic |
Definition or calculation |
|---|---|
|
Tapestry Description |
The name and segment ID of the Tapestry segment. |
|
Target Count |
This value provides the actual count of your customers in this segment. |
|
Target Percent |
This value provides the percentage of your customers in this segment. |
|
Base Count* |
This value provides the count of either adults or households in this segment within the market area. This is the population with which the customer profile is compared. |
|
Base Percent* |
This value provides the percentage of either adults or households in this segment within the market area. This is the population with which the customer profile is compared. |
|
Penetration* |
This value provides the percentage of target customers per 100 people or households in the base population. |
|
Index* |
The Index value for each segment measures the percentage of customers versus the percentage of people in the market area. An index above 100 means that you are attracting customers from this segment at a higher rate than they occur in the market area. For example, if 10 percent of customers in the customer profile and 5 percent of households from the market area profile are assigned to segment X, the index is 200 (10% / 5% * 100). This indicates that you are attracting customers from this segment at twice the rate at which they occur in the market area. |
|
Total Volume** |
This value provides the sum of the volumetric field values for each segment. The volumetric field is selected during creation of the customer profile. |
|
Average Volume** |
This value provides the average volume per customer in each segment. |
|
Average Volume Index** |
This value provides the average volume for each segment, compared to the overall average volume. A volume index above 100 means that the segment’s average volume is higher than that of the overall market. An index below 100 indicates a lower average volume than the overall market. |
* Indicates a statistic only present in Customer Tapestry Profile report
** Indicates a statistic only present in Customer Tapestry Profile with Volume report
Segments by Index chart
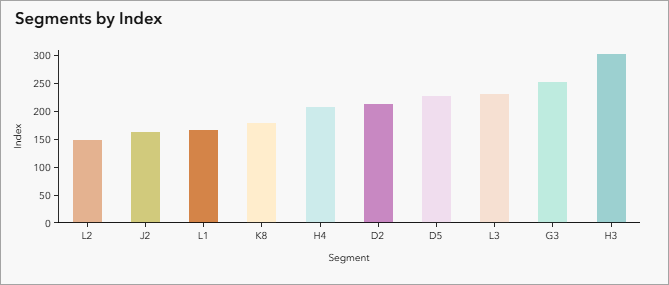
The Segments by Index chart displays color-coded bars indicating the index values for the top ten segments in the market area. In the Customer Tapestry Profile with Volume report, this chart indicates index values for the volumetric field. When the report is created as HTML, this chart can be filtered and sorted. For example, you can filter the chart to show a different number of top or bottom segments.
|
Statistic |
Definition or calculation |
|---|---|
|
Segment |
The segment ID of the Tapestry segment. |
|
Index |
The Index value for each segment measures the percentage of customers versus the percentage of people in the market area. An index above 100 means that you are attracting customers from this segment at a higher rate than they occur in the market area. For example, if 10 percent of customers in the customer profile and 5 percent of households from the market area profile are assigned to segment X, the index is 200 (10% / 5% * 100). This indicates that you are attracting customers from this segment at twice the rate at which they occur in the market area. |
|
Average volume index** |
This value provides the average volume for each segment, compared to the overall average volume. A volume index above 100 means that the segment’s average volume is higher than that of the overall market. An index below 100 indicates a lower average volume than the overall market. |
** Indicates a statistic only present in Customer Tapestry Profile with Volume report
Index Chart
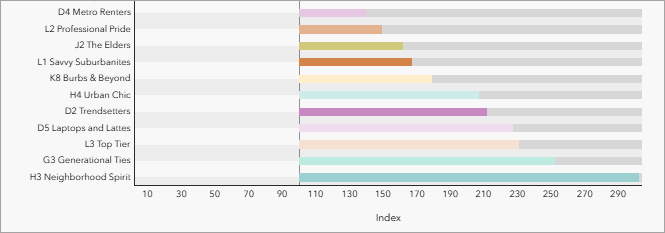
The Index Chart displays color-coded bars indicating the index values for all segments present in the market area. The vertical line at the value of 100 indicates the national average for this segment. The bars with Index values greater than 100 have a positive direction compared to the market area, and bars with values less than 100 (less than the average for the market area) have a negative direction.
In the Customer Tapestry Profile with Volume report, this chart is called Average Volume Index Bar Chart, and indicates index values for the volumetric field. When the report is created as HTML, this chart can be filtered and sorted.
|
Statistic |
Definition or calculation |
|---|---|
|
Segment |
The name and segment ID of the Tapestry segment. |
|
Index |
The Index value for each segment measures the percentage of customers versus the percentage of people in the market area. An index above 100 means that you are attracting customers from this segment at a higher rate than they occur in the market area. For example, if 10 percent of customers in the customer profile and 5 percent of households from the market area profile are assigned to segment X, the index is 200 (10% / 5% * 100). This indicates that you are attracting customers from this segment at twice the rate at which they occur in the market area. |
|
Average volume index** |
This value provides the average volume for each segment, compared to the overall average volume. A volume index above 100 means that the segment’s average volume is higher than that of the overall market. An index below 100 indicates a lower average volume than the overall market. |
** Indicates a statistic only present in Customer Tapestry Profile with Volume report
LifeMode Groups summary
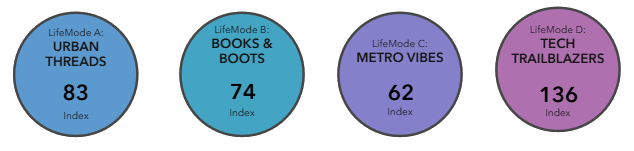
The LifeMode Groups summary displays the index within the market area for each LifeMode group in the ArcGIS Tapestry system. LifeMode groups represent markets that share a common experience—born in the same generation or immigration from another country, for example—or a significant demographic trait, such as affluence.
In the Customer Tapestry Profile with Volume report, the summary indicates index values for the volumetric field.
|
Statistic |
Definition or calculation |
|---|---|
|
LifeMode group |
The name and ID of the LifeMode group. |
|
Index |
The Index value for each LifeMode group measures the percentage of customers versus the percentage of people in the market area. An index above 100 means that you are attracting customers from this LifeMode group at a higher rate than they occur in the market area. For example, if 10 percent of customers in the customer profile and 5 percent of households from the market area profile are assigned to LifeMode X, the index is 200 (10% / 5% * 100). This indicates that you are attracting customers from this LifeMode group at twice the rate at which they occur in the market area. |
LifeMode Group tables
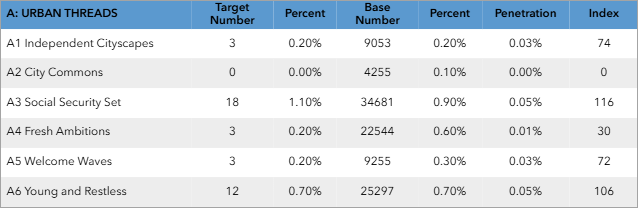
The LifeMode Group tables list each Tapestry segment in each LifeMode Group, providing statistics that compare each segment's prevalence in the target group to its prevalence in the market area. When the report is created as HTML, these tables can be filtered, sorted, and viewed as charts.
|
Statistic |
Definition or calculation |
|---|---|
|
LifeMode Group |
The name and ID of the LifeMode group. |
|
Tapestry Description |
The name and segment ID of the Tapestry segment. |
|
Target Number |
This value provides the count of your customers in this segment. |
|
Percent |
This value provides the percentage of your customers that are assigned to the segment. |
|
Base Number* |
This value provides the count of either adults or households in this segment within the market area. This is the population with which the customer profile is compared. |
|
Percent* |
This value provides the percentage of either adults or households in this segment within the market area. This is the population with which the customer profile is compared. |
|
Penetration* |
This value provides the percentage of your customers per 100 people in the market area. |
|
Index* |
The Index value for each segment measures the percentage of customers versus the percentage of people in the market area. An index above 100 means that you are attracting customers from this segment at a higher rate than they occur in the market area. For example, if 10 percent of customers in the customer profile and 5 percent of households from the market area profile are assigned to segment X, the index is 200 (10% / 5% * 100). This indicates that you are attracting customers from this segment at twice the rate at which they occur in the market area. |
|
Total Volume** |
This value provides the sum of the volumetric field values for each segment. The volumetric field is selected during creation of the customer profile. |
|
Average Volume** |
This value provides the average volume per customer in each segment. |
|
Average Volume Index** |
This value provides the average volume for each segment, compared to the overall average volume. A volume index above 100 means that the segment’s average volume is higher than that of the overall market. An index below 100 indicates a lower average volume than the overall market. |
* Indicates a statistic only present in Customer Tapestry Profile report
** Indicates a statistic only present in Customer Tapestry Profile with Volume report
Developing Market Strategies report
This report provides an overview of the media that your target customers read, listen to, and watch. It helps guide decisions about how to reach your target segment groups based on the media they consume. The target marketing wizard uses the Generate Survey Report for Targets tool to create a Developing Market Strategies report for your customers. You can also use the Generate Survey Report for Profile tool to create a Developing Market Strategies report for the general market area.
Information about media habits comes from a syndicated customer survey conducted by MRI-Simmons. As such, the information included is not actual rating data. Your advertising agency can provide information about television viewing and radio listening habits. Information about the magazine and newspaper reading habits reflect data about people who read these publications regularly. They may not be subscribers to the publication. Television viewing information is based on customers’ responses as to whether they watch a program.
This report compares your customer profile to the segmentation profile of media survey respondents to determine the top media characteristics of your customers. If an index is above 100, then your customers are more likely to consume this media than the average U.S. household.
Report sample
To view a sample report in HTML format, click the link below:
- Developing Market Strategies report (sample)
Report components
This report includes tables and charts that provide context for the analysis. Each component is described below.
Top Media Characteristics by Index indicators
The Top Media Characteristics by Index indicators display the three forms of media consumed at the highest rates by the Core and Developmental targets in your analysis.
Additional details about the media characteristics of your customer profile are available on the subsequent pages of the report.

|
Statistic |
Definition or calculation |
|---|---|
|
Watch |
This value represents the top overall index for watching or streaming a television program for your customer profile. |
|
Listen |
This value represents the top overall index audio programming for your customer profile. |
|
Read |
This value represents the top overall index for reading magazines and newspapers for your customer profile. |
|
Index |
An index average is 100. An index value of 350, for example, indicates that these adults or households are 3.5 times as likely to consume this media than the national average. |
Top Media Characteristics by Index table and chart
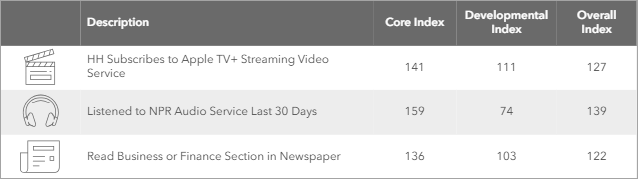
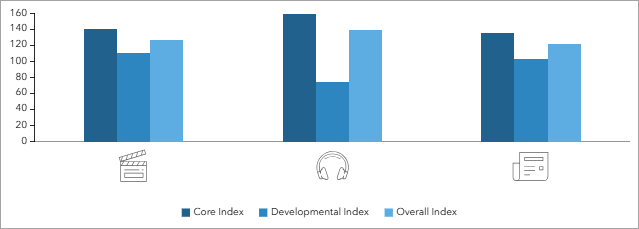
The Top Media Characteristics by Index table and chart display the three forms of media that index at the highest rates by the Core and Developmental targets in your analysis, displaying individual values for each target as well as the overall index for the analysis. When the report is created as HTML, the table and chart can be filtered.
|
Statistic |
Definition or calculation |
|---|---|
|
Watch |
This value represents the top overall index for watching or streaming a television program for your customer profile. |
|
Listen |
This value represents the top overall index for audio programming for your customer profile. |
|
Read |
This value represents the top overall index for reading magazines and newspapers for your customer profile. |
|
Core Index |
This value uses your customer profile to calculate a weighted Index value that takes into account the percent composition for each segment in the Core target. |
|
Developmental Index |
This value uses your customer profile to calculate a weighted Index value that takes into account the percent composition for each segment in the Developmental target. |
|
Overall Index |
This value uses your customer profile to calculate a weighted Index value that takes into account the percent composition for each segment in your target group |
Top Media tables
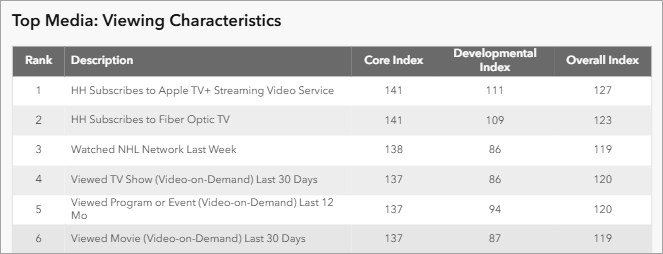
The Top Media tables (Viewing Characteristics, Listening Characteristics, and Reading Characteristics) list the twenty most popular media in this market area, ordered from highest-indexing to lowest-indexing among your Core and Developmental customers. When the report is created as HTML, this table can be filtered.
|
Statistic |
Definition or calculation |
|---|---|
|
Watch |
This value represents the top overall index for watching or streaming a television program for your customer profile. |
|
Listen |
This value represents the top overall index audio programming for your customer profile. |
|
Read |
This value represents the top overall index for reading magazines and newspapers for your customer profile. |
|
Core Index |
This value uses your customer profile to calculate a weighted Index value that takes into account the percent composition for each segment in the Core target. |
|
Developmental Index |
This value uses your customer profile to calculate a weighted Index value that takes into account the percent composition for each segment in the Developmental target. |
|
Overall Index |
This value uses your customer profile to calculate a weighted Index value that takes into account the percent composition for each segment in your target group |
Market Area and Gap Analysis report
This report builds on information included in the Market Area and Gap Analysis map layer. It uses the customer profile you created, calculating an expected number of customers based on the number of households in a geographic unit and their Tapestry composition. The report details the gap, or the difference, between actual customers and expected customers. The report is generated using the Analyze Market Area Gap geoprocessing tool.
Report sample
To view a sample report in HTML format, click the link below:
- Market Area and Gap Analysis report (sample)
Report components
This report includes tables and charts that provide context for the analysis. Each component is described below.
Market Area Summary indicators
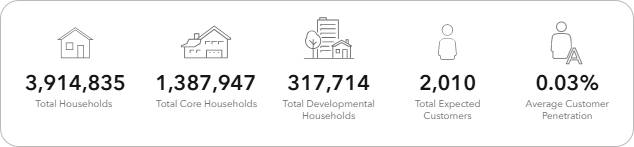
The Market Area Summary indicators display the statistical expectations for your customer base, based on the Tapestry composition of the market area.
|
Statistic |
Definition or calculation |
|---|---|
|
Total Households |
This value represents the total number of households in your analysis. |
|
Total Core Households |
This value represents the number of households in this area that are assigned to one of your Core segments. Your Core target consists of segments that contain a disproportionately large percentage of your customer base compared to the market area. |
|
Total Developmental Households |
This value represents the number of households in this area that are assigned to one of your Developmental segments. Your Developmental target consists of segments that make up a significant percentage of your customers, but do not have an above-average index. |
|
Total Expected Customers |
This value represents the sum of all features in your analysis, providing a total Expected Customers value for your market. The Expected Customers value is calculated by first calculating the penetration rate for each segment in your target profile. Then the penetration rates are applied to the respective base count in the corresponding segment. Lastly, the number of expected customers is summarized across all segments for each record in the selected geography. |
|
Average Customer Penetration |
This value summarizes penetration rates across all geographic areas in your analysis. Penetration is calculated by dividing the number of customers in each geography by the corresponding base. For example, if a ZIP code contains 20 customers and 200 households, the penetration is calculated as follows: 20/200 = 0.1. |
Highest Performing Areas and Lowest Performing Areas tables
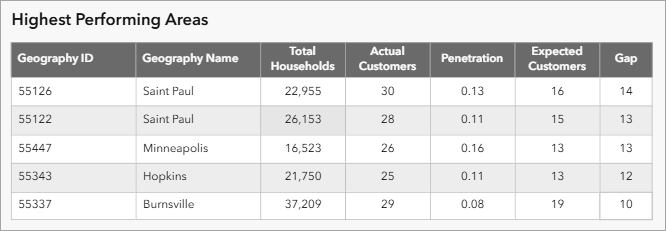
These tables provide the top five and bottom five areas with the largest gaps between actual and expected number of customers.
The Highest Performing Areas table shows the locations where the actual number of customers is greater than or closest to expected (the largest positive gap). These are areas where you are currently performing the best.
The Lowest Performing Areas table shows the locations where the actual number of customers is fewer than expected (the largest negative gap). These are areas where you are currently underperforming.
When the report is created as HTML, these tables can be filtered, sorted, and viewed as charts.
|
Statistic |
Definition or calculation |
|---|---|
|
Total Households |
This value represents the total number of households in your analysis. |
|
Actual Customers |
This value summarizes data from your input customer layer to create a count for each geographic area. |
|
Penetration |
This value is calculated by dividing the number of customers in each geographic area by the corresponding base. For example, if a ZIP code contains 20 customers and 200 households, the penetration is calculated as follows: 20/200 = 0.1. |
|
Expected Customers |
This value is calculated by first calculating the penetration rate for each segment in your target profile. Then the penetration rates are applied to the respective base count in the corresponding segment. Lastly, the number of expected customers is summarized across all segments for each geographic area. |
|
Gap |
This value is calculated by subtracting the Expected Customers value from the Actual Customers value. |
Market Potential report
This report builds on information included in the Market Potential map layer. It calculates expected customers, as well as the expected market penetration rate. The report allows you to see where you are over- and underperforming. Based on the optional volumetric parameter set during customer profile creation, this report can also be generated as a Market Potential with Volume report. The report is generated using the Analyze Market Potential geoprocessing tool.
Report samples
To view a sample report in HTML format, click a link below:
Market Potential report (sample)
Market Potential with Volume report (sample)
Report components
This report includes tables and charts that provide context for the analysis. Each component is described below.
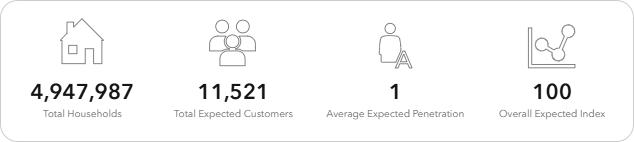
Market Potential Summary indicators
The Market Potential Summary indicators display the statistical expectations for your customer base, based on the Tapestry composition of the market area. In the Market Potential with Volume report, the statistics project expected values based on the volumetric field selected in the customer profile.
|
Statistic |
Definition or calculation |
|---|---|
|
Total Households* |
This value represents the total number of households in your analysis. |
|
Total Expected Customers* |
This value represents the sum of all features in your analysis, providing a total Expected Customers value for your market. The Expected Customers value is calculated by first calculating the penetration rate for each segment in your target profile. Then the penetration rates are applied to the respective base count in the corresponding segment. Lastly, the number of expected customers is summarized across all segments for each record in the selected geography. |
|
Average Expected Penetration* |
This value represents the average penetration for all geographic areas in your analysis. The Expected Penetration value is calculated by dividing the number of expected customers in each geography with the corresponding base value, such as number of households or adults. For example, if a ZIP code contains 20 percent expected customers out of 400 households, the expected penetration is 0.05, or 5 percent. |
|
Overall Expected Index* |
This value represents the overall total expected index for your analysis. The Expected Index value is calculated by dividing the Expected Penetration value for each geography with the overall Expected Penetration rate and multiplying by 100. The results are then rounded to whole numbers. For example, if a ZIP code has an Expected Penetration rate of 0.5 percent and the overall Expected Penetration rate is 0.25 percent, the Expected Index is 200. |
|
Overall Segmentation Base Total** |
This value represents the total number of households or adults in your analysis. |
|
Total Expected Volume** |
This value represents the total of the Expected Volume value. |
|
Overall Expected Average Volume** |
This value represents a total of weighted averages for expected average volume. For each geography, the expected average volume is weighted by the average of the segmentation base—adults or households. Then those values are totaled. |
|
Overall Expected Volume Index** |
This value represents a total of weighted averages for expected volume indexes. For each geography, the expected volume index is weighted by the average of the segmentation base—adults or households. Then these values are totaled. |
* Indicates a statistic only present in Market Potential report
** Indicates a statistic only present in Market Potential with Volume report
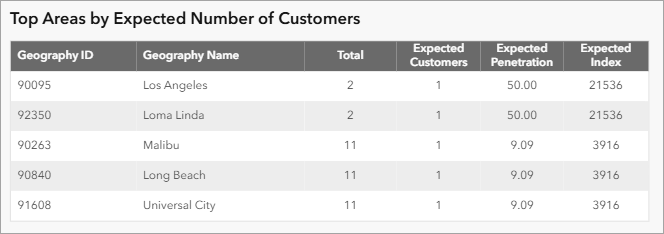
Top Areas by Expected Number of Customers table
This table lists the locations with the highest number of expected customers, or expected revenue, in the analysis. In the Market Potential with Volume report, this table is called Top Areas by Expected Volume and uses the volumetric field added during customer profile creation for the calculations. When the report is created as HTML, the column widths of this table can be adjusted.
|
Statistic |
Definition or calculation |
|---|---|
|
Total* |
This value provides the total number of households or adults in each area. |
|
Expected Customers |
This value is calculated by first calculating the penetration rate for each segment in your customer profile. Then the penetration rates are applied to the respective base count in the corresponding segment. Lastly, the Expected Customers values are summarized across all segments for each record in the selected geography. |
|
Expected Penetration* |
This value is calculated by dividing the number of expected customers in each geography with the corresponding base value, such as number of households or adults. For example, if a ZIP code contains 20 percent expected customers of 400 households, the expected penetration is 0.05, or 5 percent. |
|
Expected Index* |
This value is calculated by dividing the Expected Penetration value for each geography with the overall penetration rate and multiplying by 100. The results are then rounded to whole numbers. For example, if a ZIP code has an expected penetration rate of 0.5 percent and the overall penetration rate is 0.25 percent, the expected index is 200. |
|
Segmentation Base Total** |
This value provides a sum of the selected base—typically households or adults—for each geography. |
|
Expected Volume** |
This value is calculated by first determining the penetration rate for each segment. Then the total volume for each segment is multiplied by the segment’s penetration rate. This occurs for each geography in the study area. Lastly, the expected volume is summarized across all segments for each record in the selected geography level. |
|
Expected Average Volume** |
This value is calculated by dividing the Expected Volume value in each geography by the corresponding expected customers. For example, if a ZIP code has an expected volume of 500 and there are 10 expected customers, the expected average volume is 50. |
|
Expected Volume Index** |
This value is calculated by dividing the Expected Average Volume value for each geography by the overall penetration rate and multiplying by 100. The results are then rounded up to whole numbers. For example, if a ZIP code has an expected average volume rate of 0.5 percent and the overall penetration rate is 0.25 percent, the expected volume index is 200. |
* Indicates a statistic only present in Market Potential report
** Indicates a statistic only present in Market Potential with Volume report
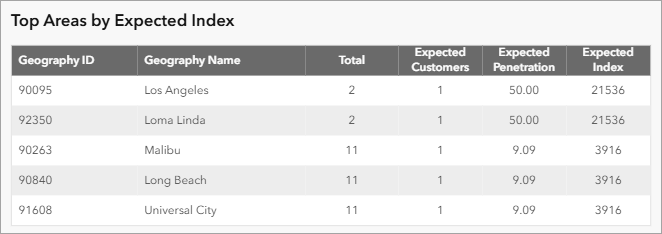
Top Areas by Expected Index table
This table lists the locations with the highest number of expected customers, or expected revenue, in the analysis using index values. In the Market Potential with Volume report, this table is called Top Areas by Expected Volume and uses the volumetric field added during customer profile creation for the calculations. When the report is created as HTML, the column widths of this table can be adjusted.
|
Statistic |
Definition or calculation |
|---|---|
|
Total* |
This value provides the total number of households or adults in each area. |
|
Expected Customers |
This value is calculated by first calculating the penetration rate for each segment in your customer profile. Then the penetration rates are applied to the respective base count in the corresponding segment. Lastly, the Expected Customers values are summarized across all segments for each record in the selected geography. |
|
Expected Penetration* |
This value is calculated by dividing the number of expected customers in each geography with the corresponding base value, such as number of households or adults. For example, if a ZIP code contains 20 percent expected customers of 400 households, the expected penetration is 0.05, or 5 percent. |
|
Expected Index* |
This value is calculated by dividing the Expected Penetration value for each geography with the overall penetration rate and multiplying by 100. The results are then rounded to whole numbers. For example, if a ZIP code has an expected penetration rate of 0.5 percent and the overall penetration rate is 0.25 percent, the expected index is 200. |
|
Segmentation Base Total** |
This value provides a sum of the selected base—typically households or adults—for each geography. |
|
Expected Volume** |
This value is calculated by first determining the penetration rate for each segment. Then the total volume for each segment is multiplied by the segment’s penetration rate. This occurs for each geography in the study area. Lastly, the expected volume is summarized across all segments for each record in the selected geography level. |
|
Expected Average Volume** |
This value is calculated by dividing the Expected Volume value in each geography by the corresponding expected customers. For example, if a ZIP code has an expected volume of 500 and there are 10 expected customers, the expected average volume is 50. |
|
Expected Volume Index** |
This value is calculated by dividing the Expected Average Volume value for each geography by the overall penetration rate and multiplying by 100. The results are then rounded up to whole numbers. For example, if a ZIP code has an expected average volume rate of 0.5 percent and the overall penetration rate is 0.25 percent, the expected volume index is 200. |
* Indicates a statistic only present in Market Potential report
** Indicates a statistic only present in Market Potential with Volume report