Target marketing reference
The Target Marketing workflow uses demographic segmentation to create a multi-dimensional profile of your current customers based on where they live. The workflow can provide answers to the following questions:
What are my core customers like? How well am I reaching them?
What other types of customers should I be targeting? Where do they live?
What media do my customers consume?
Who are my "best" customers and how do I find more of them?
Where is there opportunity for growth in my customer base?
This topic describes how the workflow is performed, including calculations, examples, and outputs.
Example
An athleisure clothing company wants to understand where they should focus their outreach efforts based on their customer data points. They use target marketing to create a profile of their customer base, designing targets that represent their best customers (known as "Core" targets) as well as their occasional customers (known as "Developmental" targets). The profile reveals that their customers largely belong to segments of young, educated residents in urban neighborhoods and young, high-earning, mobile urban professionals. The clothing company creates map layers and reports that illustrate how well the company is currently penetrating these markets, and where further growth might be found.
Limitations
To perform target marketing, the following limitations apply:
You must connect to a local dataset containing market segmentation data, such as a local Canada dataset containing PRIZM data or a U.S. dataset containing ArcGIS Tapestry data.
It is recommended that you have customer location point data to use as input for the workflow.
Credits
Because this workflow requires the use of a local dataset, it does not consume ArcGIS credits.
Customer profile
Customer profiles are created with the Generate Customer Segmentation Profile tool. This tool can be accessed within the Target Marketing workflow or through the Target Marketing toolset.
Customer profile settings
When you create a customer profile, there are settings that inform the rest of the analysis and calculations:
Segmentation Base—The population base for the segment calculations in the analysis. The segmentation base should be selected based on the business or product type. For example:
Items purchased by an individual, such as an article of clothing, should use the Total Adult Population base.
Items that are purchased for a household, like a major appliance, should use the Total Households base.
Volumetric Field—A numeric field in the customer layer that can be used to weight calculations in the analysis. For more information, see Weights and volumetric fields.
Customer profile catalog item
Customer profiles are stored as items in the Target Marketing subfolder of the Business Analyst node in the Catalog pane. You can also open the customer profile using the Customer Profile button on the four-quadrant analysis chart.
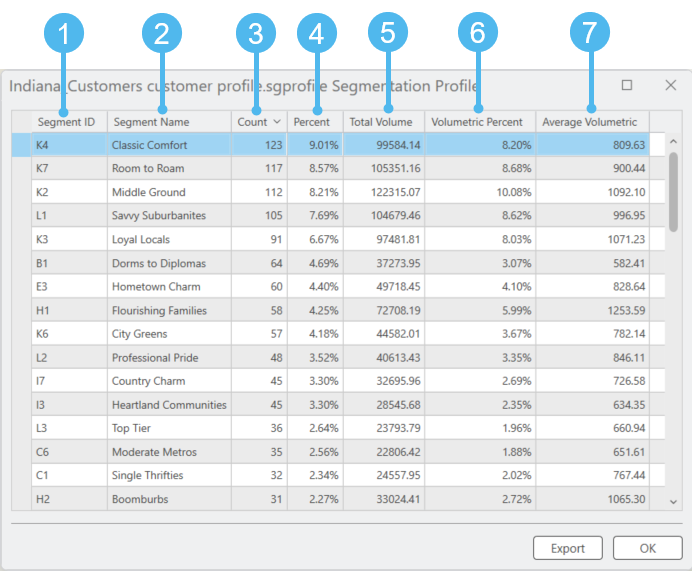
| Element | Name | Description |
|---|---|---|
| 1 | Segment ID | The alphanumeric code for a segment. In this example, the segment ID comes from ArcGIS Tapestry data. |
| 2 | Segment Name | The descriptive name of a segment. In this example, the segment name comes from ArcGIS Tapestry data. |
| 3 | Count | The number of your customer points located within block groups in which this segment is the predominant segment. |
| 4 | Percent | The percentage of your customer points located within a block group in which this segment is the predominant segment. |
| 5 | Total Volume | The sum of the volume field for all customers located within block groups in which this segment is the predominant segment. |
| 6 | Volumetric Percent | The percentage of the total volume for all customers located within block groups in which this segment is the predominant segment. |
| 7 | Average Volumetric | The average of the volume field across all customers located within block groups in which this segment is the predominant segment. |
Customer profile calculations
When you perform target marketing, you start by creating a customer profile that describes your existing customers using segmentation data. The customer profile can be based on either customer location point data or survey data that uses points. Each point is assigned a segment based on the census block group it is located in.
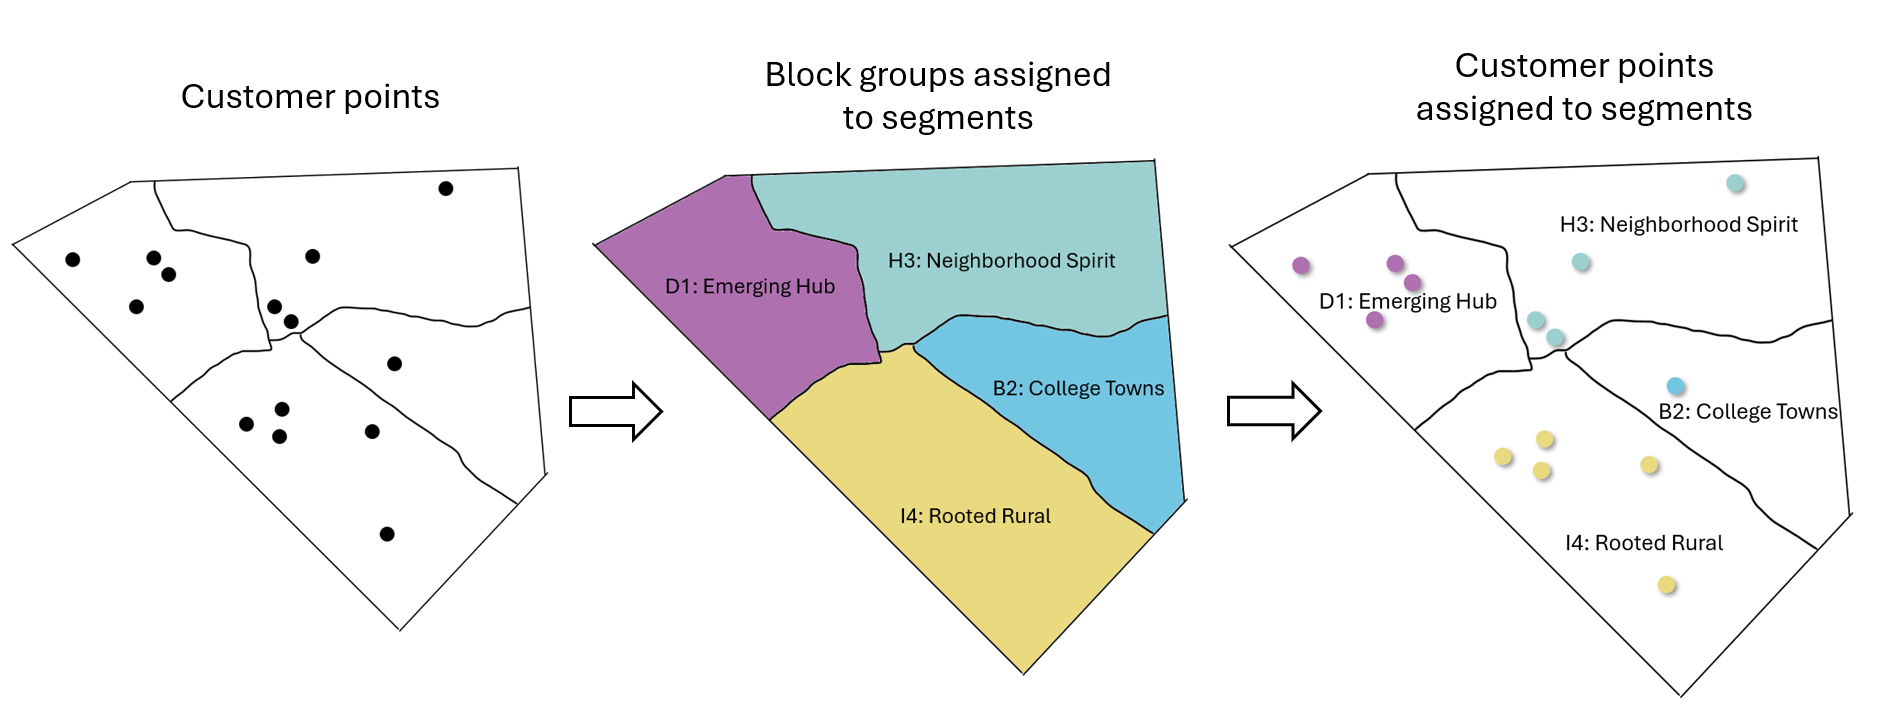
In this example, there are 14 total customer points. Using the count of points assigned to each predominant ArcGIS Tapestry segment, the customer profile would look like this:
| Segment ID | Segment Name | Count | Percent |
|---|---|---|---|
| D1 | Emerging Hub | 4 | 4 / 14 = 28.57% |
| H3 | Neighborhood Spirit | 4 | 4 / 14 = 28.57% |
| I4 | Rooted Rural | 5 | 5 / 14 = 35.71% |
| B2 | College Towns | 1 | 1 / 14 = 7.14% |
Market area profile
Market area profiles are created with the Generate Market Area Segmentation Profile tool. This tool can be accessed within the Target Marketing workflow or through the Target Marketing toolset.
Market area profile catalog item
Market area profiles are stored as items in the Target Marketing subfolder of the Business Analyst node in the Catalog pane. You can also open the market area profile using the Market Area Profile button on the four-quadrant analysis chart.

| Element | Name | Description |
|---|---|---|
| 1 | Segment ID | The alphanumeric code for a segment. In this example, the segment ID comes from ArcGIS Tapestry data. |
| 2 | Segment Name | The descriptive name of a segment. In this example, the segment name comes from ArcGIS Tapestry data. |
| 3 | Count | The total number of adults or households (depending on what you selected as your segmentation base during customer profile creation) in the market area living in block groups in which this segment is the predominant segment. |
| 4 | Percent | The percentage of adults or households (depending on what you selected as your segmentation base during customer profile creation) in the market area living in block groups in which this segment is the predominant segment. |
Market area profile calculations
After creating or adding a customer profile, you create a market area profile that describes the demographics of the area you are analyzing. The market area profile provides a segmentation overview of the map extent (or other chosen market area), which will be used for comparison with your customers. The market area profile is based on the adult or household population (depending on what you selected as your segmentation base during customer profile creation) of the block groups in the market area you define. The adult or household population of each block group is assigned a segment based on its census block group.

In this example, the block groups in the market area have a total population of 50,000. Using the count of the population assigned to each predominant ArcGIS Tapestry segment, the market area profile would look like this:
| Segment ID | Segment Name | Count | Percent |
|---|---|---|---|
| D1 | Emerging Hub | 13,527 | 13,527 / 50,000 = 27.05% |
| H3 | Neighborhood Spirit | 16,422 | 16,422 / 50,000 = 32.84% |
| I4 | Rooted Rural | 14,924 | 14,924 / 50,000 = 29.84% |
| B2 | College Towns | 5,127 | 5,127 / 50,000 = 10.25% |
Target group
Target groups are created with the Create Target Group tool. This tool can be accessed within the Target Marketing workflow or through the Target Marketing toolset.
Target group in workflow pane
When accessed through the third pane of the workflow, target group configuration appears as follows:
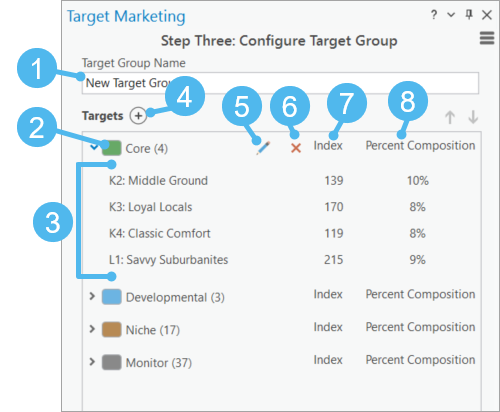
| Element | Name | Description |
|---|---|---|
| 1 | Target Group Name field | Enter a name for this target group. This name will appear in the Catalog pane when the analysis is complete. |
| 2 | Target | A group of segments in this analysis. Groups are most often created to identify and organize similar-scoring segments. The default targets are Core, Developmental, Niche, and Monitor. |
| 3 | Segments | The segments included in this target. |
| 4 | Add button | Add a new target to the target group. |
| 5 | Edit button | Modify the name of the target. |
| 6 | Delete button | Delete the target from the target group. |
| 7 | Index | The rate at which you are drawing customers from this segment, compared to the overall percentage of this segment in the market area. |
| 8 | Percent Composition | The percentage of your customers assigned to this segment based on their location. |
Target group catalog item
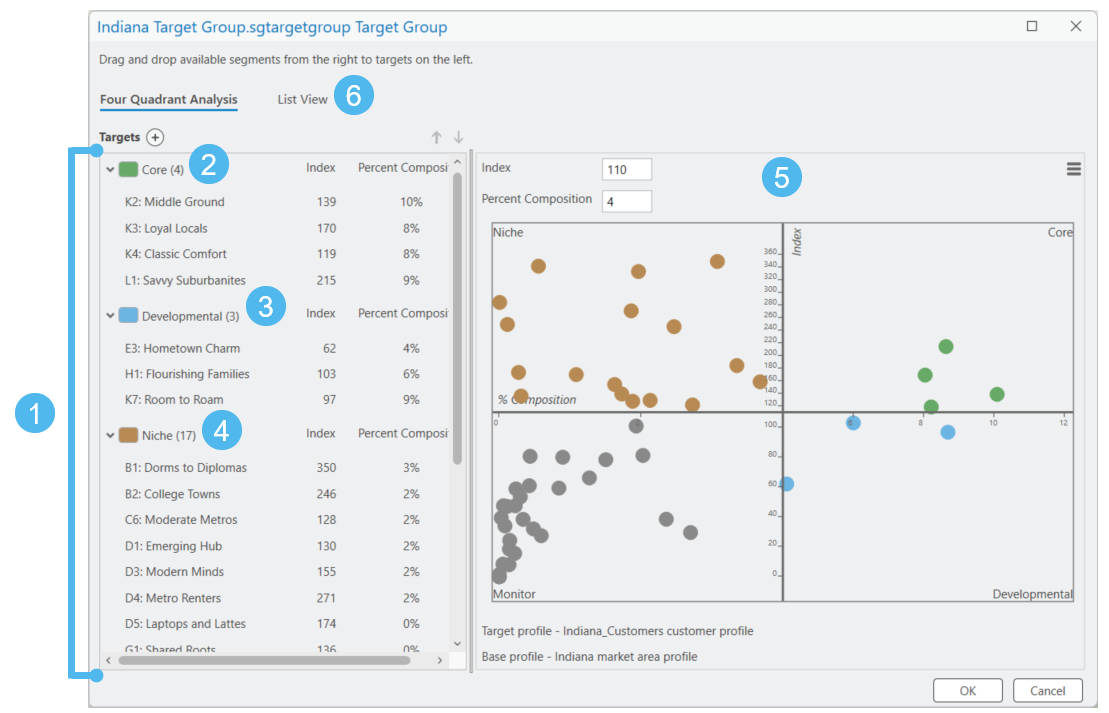
After completing the workflow, the target group is stored as an item in the Target Marketing subfolder of the Business Analyst node in the Catalog pane:
| Element | Name | Description |
|---|---|---|
| 1 | Target group | The group of all targets in this analysis. |
| 2 3 4 |
Targets | Groups of segments in this analysis. Groups are most often created to identify and organize similar-scoring segments. The default targets are Core, Developmental, Niche, and Monitor. |
| 5 | Four-quadrant analysis | Chart that displays the index value (y-axis) and percent composition (x-axis) for all segments in this analysis. |
| 6 | List view | Alternate view of targets and segments, allowing for reorganizing targets. |
Target group calculations
When you perform the workflow, your customers are assigned to segments based on where they are located. These segments are then bundled together to make targets; the default targets are called Core, Developmental, Niche, and Monitor. Targets provide information on which types of customers to focus on for outreach. Collectively, all your targets grouped together are called your target group for the analysis.
Calculations for targets rely on two measurements: the percent composition and index for each segment in the analysis.
Percent composition—The percentage of your customers assigned to each segment based on their location.
Index—The index measures the percentage of your customers assigned to a given segment against the percentage of people in that segment in the market area. An index above 100 means that you are drawing customers from that segment at a higher rate than they occur in the market area.
For example, if 10 percent of customers in the target profile and 5 percent of people in the base profile are assigned to Segment X, the index is 200 (10 percent / 5 percent * 100). This indicates that you are attracting customers from that segment at twice the rate they occur in the market area.
| Target | Description | Calculation |
|---|---|---|
| Core | These are your core customers, who patronize your organization at a disproportionate rate compared to the general population in their area. These segments represent loyalty and good opportunity. | High percentage of customers, high index |
| Developmental | These segments represent a significant portion of your customers, but are consuming your product or service at a lower rate than the general population in the market area. This is an indication of significant opportunity. | High percentage of customers, low index |
| Niche | These segments patronize your organization at a disproportionate rate compared to the general population in their area, but in small numbers. Niche segments represent opportunities when exploring new market areas for expansion. | Small percentage of customers, high index |
| Monitor | Segments in this target represent consumers that do not purchase your product or service. | Small percentage of customers, low index |
Four-quadrant analysis
The Four Quadrant Analysis pane displays segments as points on a four-quadrant chart, where the y-axis value represents the index of each segment and the x-axis value represents the percent composition of the segment.
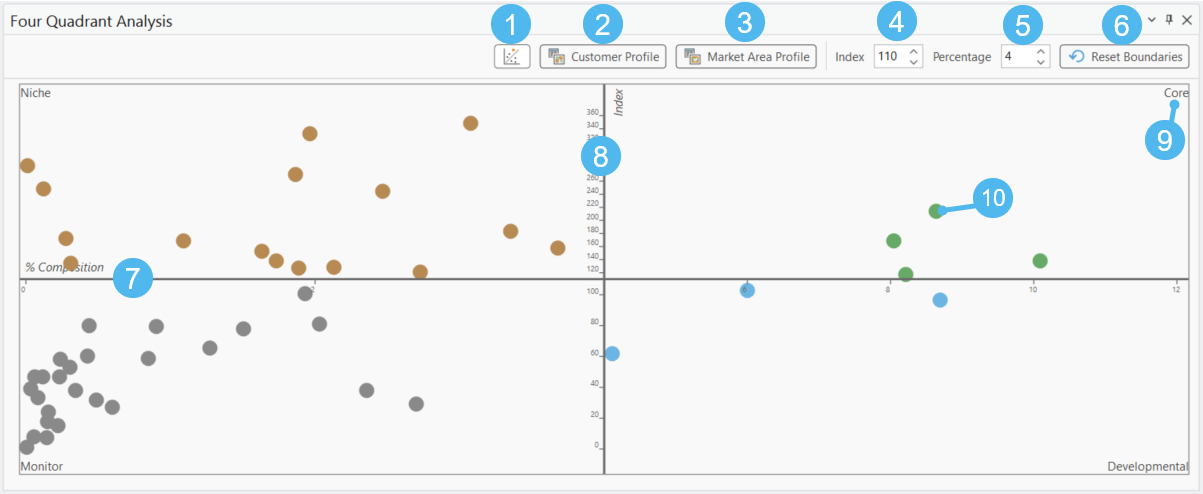
Four-quadrant analysis in the workflow
The four-quadrant analysis can be accessed within the Target Marketing workflow or by opening the target group item from the Catalog pane.
| Element | Name | Description |
|---|---|---|
| 1 | Outliers button | Turn outliers on or off in the analysis. See Outliers. |
| 2 | Customer Profile button | Open the customer profile. |
| 3 | Market Area Profile button | Open the market area profile. |
| 4 | Index field | Change the Index value in the four-quadrant analysis. |
| 5 | Percentage field | Change the Percentage value in the four-quadrant analysis. |
| 6 | Reset Boundaries | Restore the index and percentage values to their defaults (110 and 4, respectively). |
| 7 | x-axis | Represents the percent composition for segments in the analysis. |
| 8 | y-axis | Represents the index for segments in the analysis. |
| 9 | Target | Each quadrant represents a target in the analysis. The default targets are Core, Developmental, Niche, and Monitor. |
| 10 | Segment | Each segment is plotted in a quadrant, according to its index value and percent composition. |
Four-quadrant analysis calculations
After creating a customer profile and a market area profile, the next step is to compare these profiles to determine who your “best” customers are. For each segment in your analysis area, the percentage of your customers is compared to the overall prevalence of this segment in the market area, using the following formula to create an index:
Index for segment = (Customer percentage/Market area percentage) * 100
In this example, the calculations would be as follows:
| Segment ID | Segment Name | Index | Percent Composition |
|---|---|---|---|
| D1 | Emerging Hub | (28.57 / 27.05) * 100 = 105.62 | 28.57 |
| H3 | Neighborhood Spirit | (28.57 / 32.84) * 100 = 86.998 | 28.57 |
| I4 | Rooted Rural | (35.71 / 29.84) * 100 = 119.67 | 35.71 |
| B2 | College Towns | (7.14 / 10.25) * 100 = 69.66 | 7.14 |
Each segment is then plotted on a four-quadrant chart where the x-axis is the index value and the y-axis is the customer percentage. Note that the axes intersect at the default values: 110 for the index and 4 for the percentage:

Weights and volumetric fields
Some parameters within the Target Marketing workflow allow you to specify a numeric field that can be factored into certain calculations. The following outputs can include volumetric or weighted calculations.
| Output | Parameter | Calculation |
|---|---|---|
| Customer profile | Volumetric Field |
|
| Market potential map layer | Volumetric Field (entered during customer profile creation) |
|
| Customer Tapestry Profile report | Volumetric Field (entered during customer profile creation) |
|
| Market Potential report | Volumetric Field (entered during customer profile creation) |
|
| Customer Demographic Profile report | Weight Field | All demographic variable calculations are weighted by the selected weight field. Learn more about this report's calculations. |
Outliers
The four-quadrant analysis chart allows you to include or exclude segments that are deemed outliers in the analysis. You can show or hide outliers by clicking the Outliers button ![]() on the four-quadrant analysis chart.
on the four-quadrant analysis chart.
A segment is classified as an outlier if it is above or below 1.5 IQR from the mean and is less than 1% composition in the customer profile. The calculation for outliers is performed as follows:
For all values (including zero values), the IQR is calculated.
Segments with 0% composition and 0 index are excluded.
The remaining values are filtered by 1.5 IQR:
If a segment is above or below 1.5 IQR from the mean, it is considered a potential outlier.
If a segment has a percent composition greater than 1%, it is not considered an outlier even if it falls above or below 1.5 IQR. This is to avoid excluding significant parts of the customer data.
Map layers
The Target Marketing workflow creates up to five map layers that display information from the analysis.
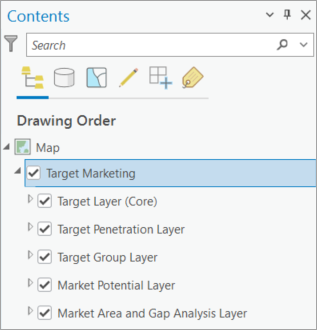
Map layers in Contents pane
The workflow creates a Target Marketing group layer in the project's Contents pane, containing map layers you opted to create: target, target penetration, target group, market potential, and market area and gap analysis layers.
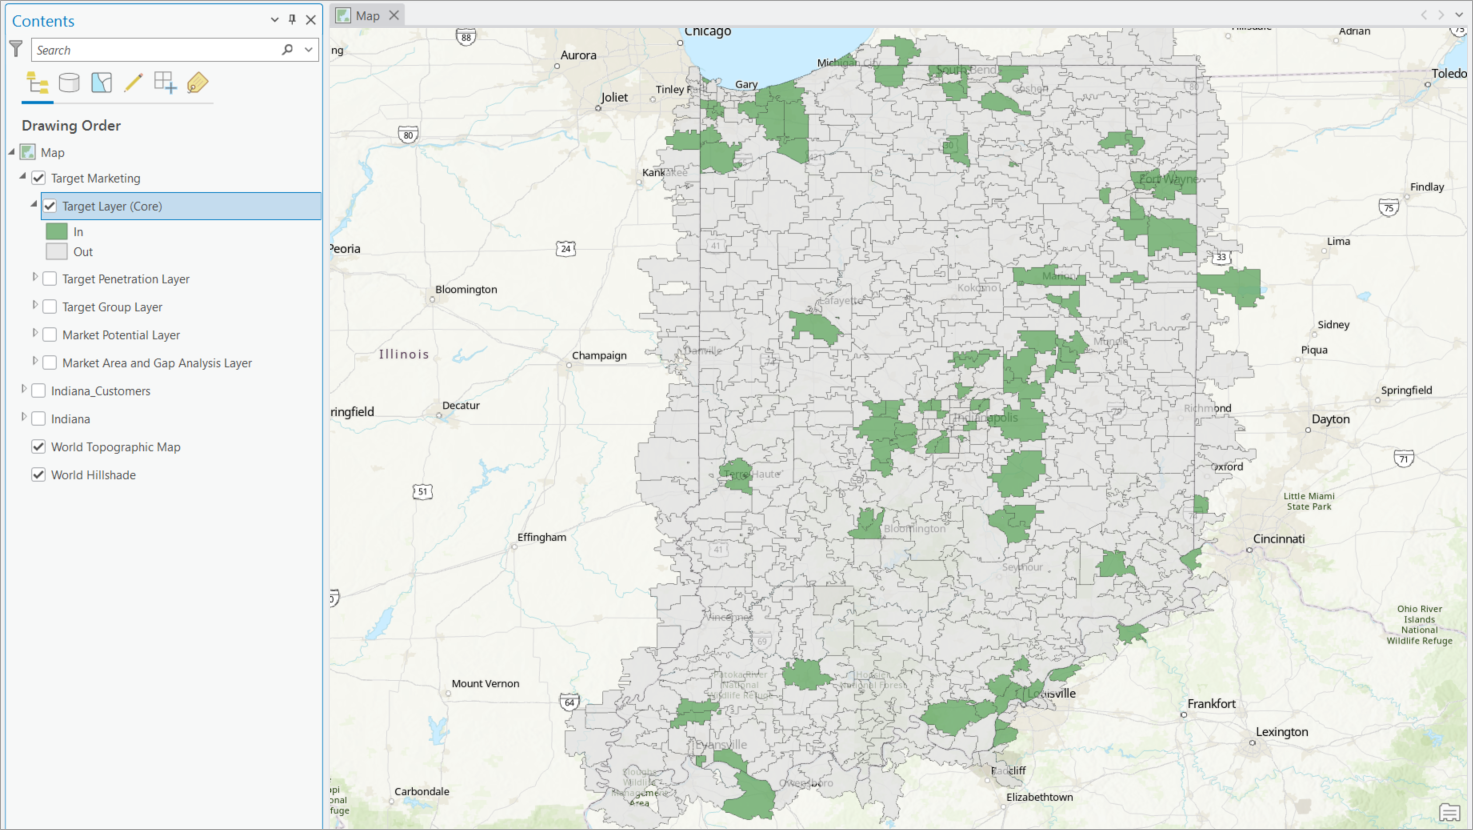
Target layer
Once you specify a target to map in this layer, the layer calculates whether each polygon in the market area is "in" or "out" of that target. For example, if a block group is "out" of the Core target, this means the block group's predominant segment is not one of the Core segments. The relevant calculations are as follows:
In—This polygon's predominant segment is one of the segments in the specified target, such as Core or Niche.
Out—This polygon's predominant segment is not one of the segments in the specified target.
If run from the geoprocessing tool, an existing target or a selected set of segments may be used as the input.
Geoprocessing tool: Generate Target Layer
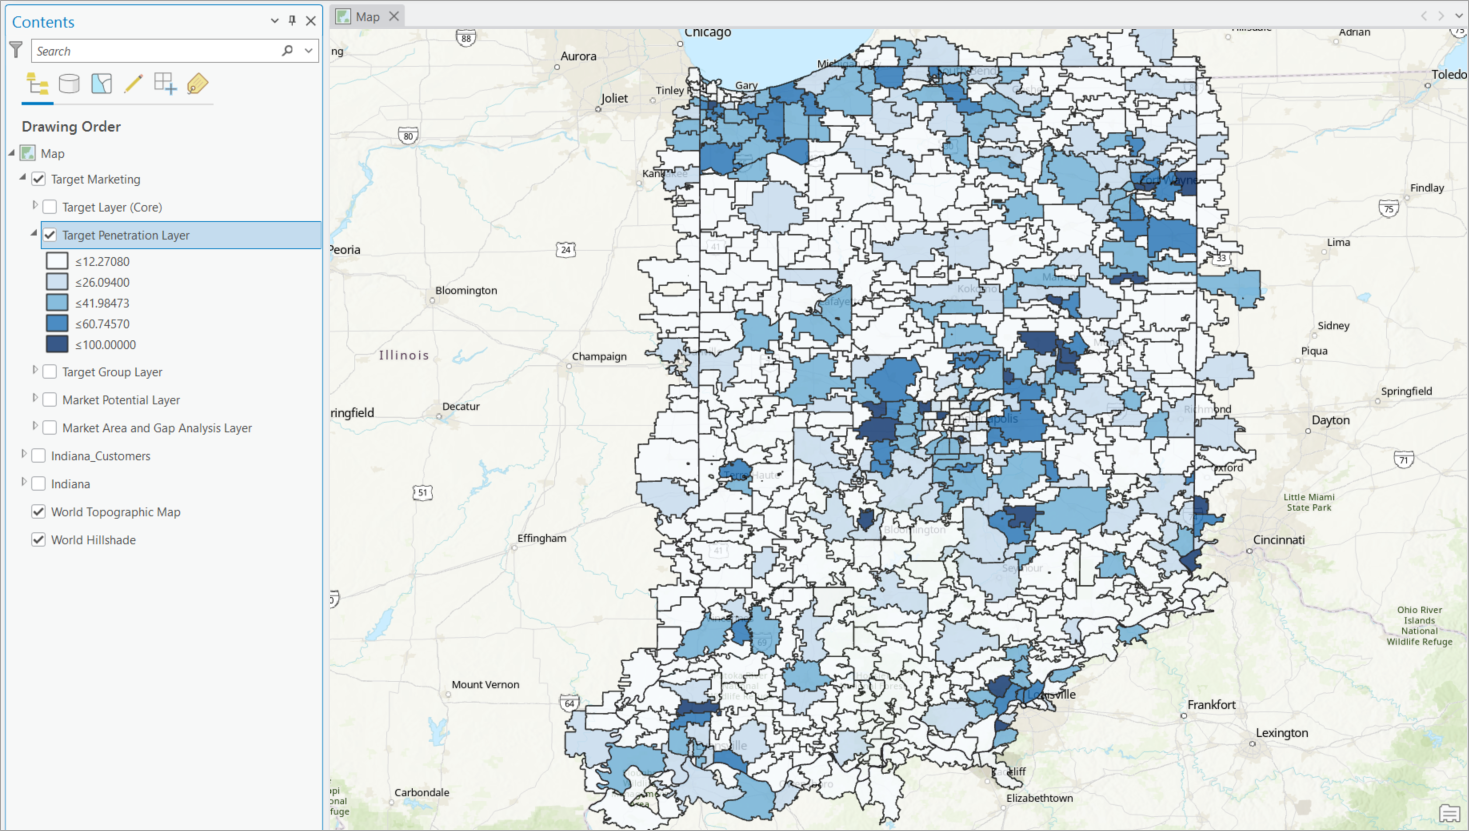
Target Penetration Layer
Once you specify a target to map in this layer, the layer uses a color-coded gradient to display how many households or people in each polygon fall into the selected target (such as Core or Developmental), relative to the number of households or people in that polygon in any segment. The relevant calculations are as follows:
Penetration is calculated by counting the number of households or people located in each polygon where the predominant segment is part of the target, and dividing the count by the total number of households or people in the polygon.
For example, if you use households as your base, select ZIP codes as the geography level, and select Developmental as the target, the household population of each underlying block group with a predominant segment that is in the Developmental target is counted. This number is divided by the total number of households with any segment as the predominant segment in the ZIP code. The resulting number is the penetration rate for the Developmental target in the ZIP code.
Tip:
This map layer is most effective when created for a geography level higher than the base geography of the analysis. For example, ArcGIS Tapestry data is mapped at the block group level; use the Geography Level drop-down list to choose census tracts or ZIP codes for a more meaningful visualization.
If creating this type of output in the workflow, an existing target must be used as the input. If accessed from the geoprocessing tool, an existing target or custom set of segments can be used.
Geoprocessing tool: Generate Target Penetration Layer
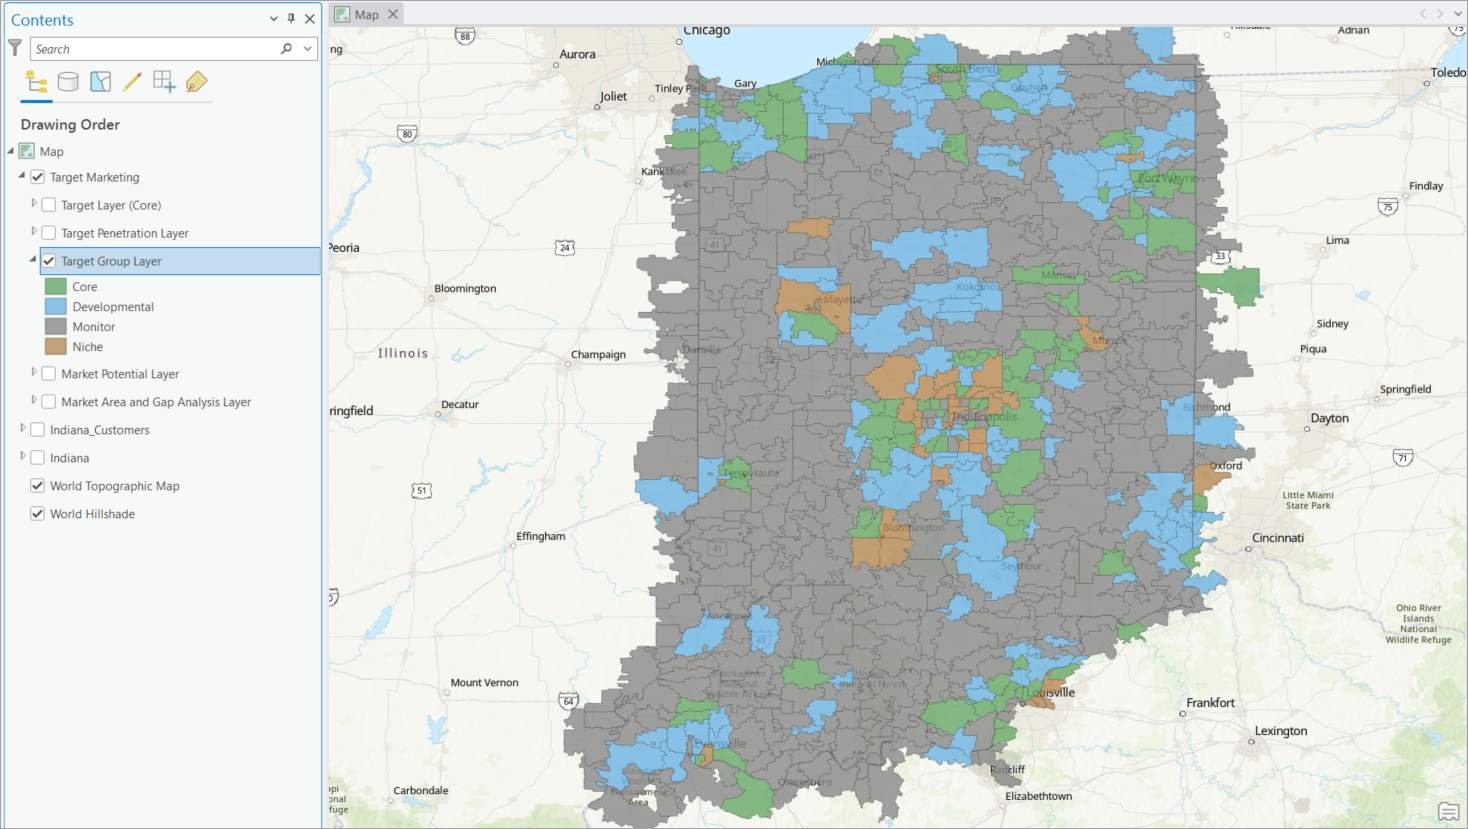
Target Group Layer
This layer displays color-coded classes for each target in the target group. Polygons in the selected geography level receive a target's shading if the predominant segment is one of the segments in the target. Using the default target group from the workflow creates a layer with four thematically shaded classes: Core, Developmental, Niche, and Monitor.
Geoprocessing tool: Generate Target Group Layer
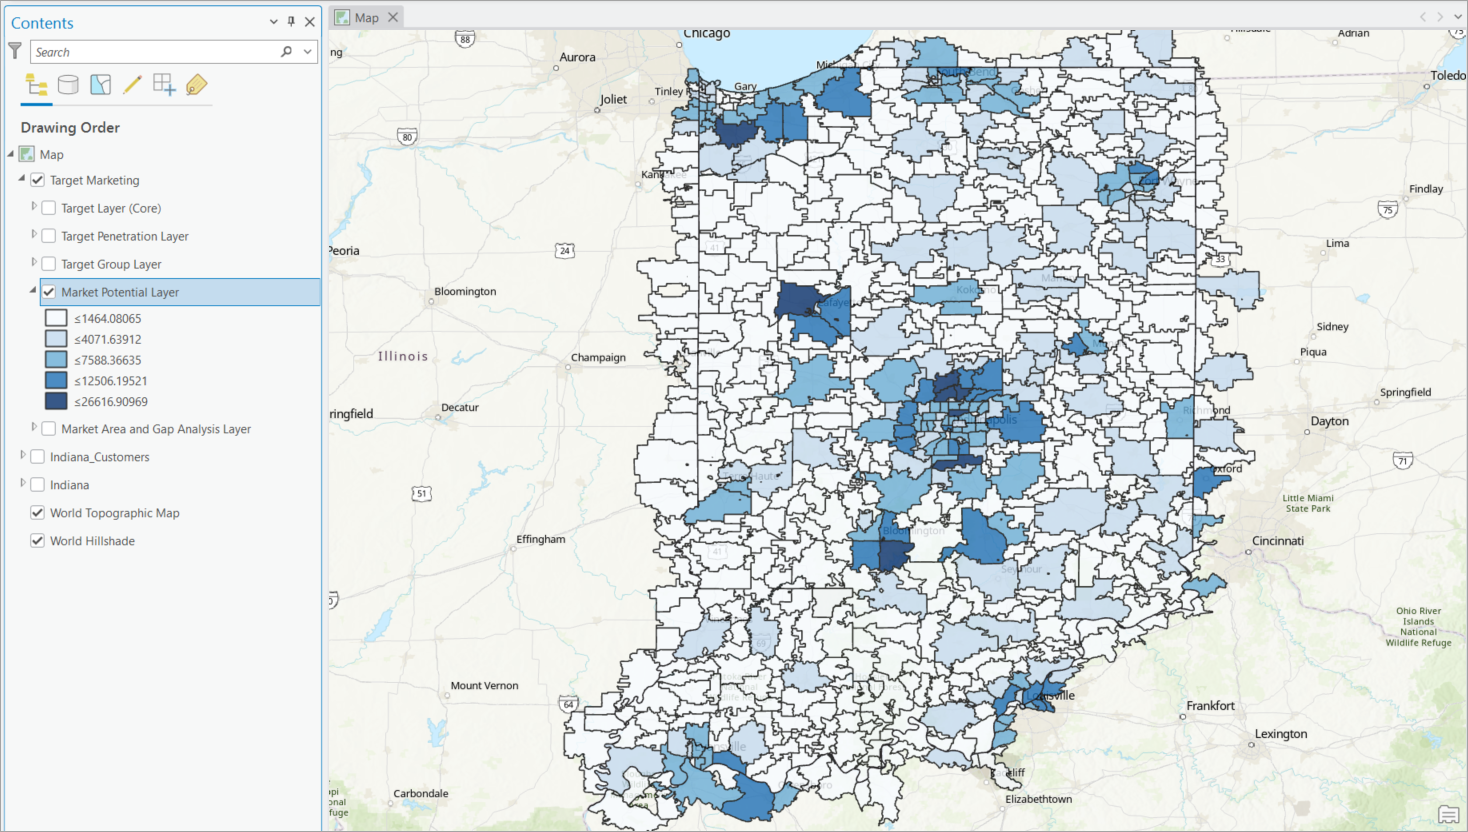
Market Potential Layer
This layer displays expected customers at a selected geography level. If your customer profile contains volume information—for example, dollars spent—expected volumes are also calculated.
Geoprocessing tool: Analyze Market Potential
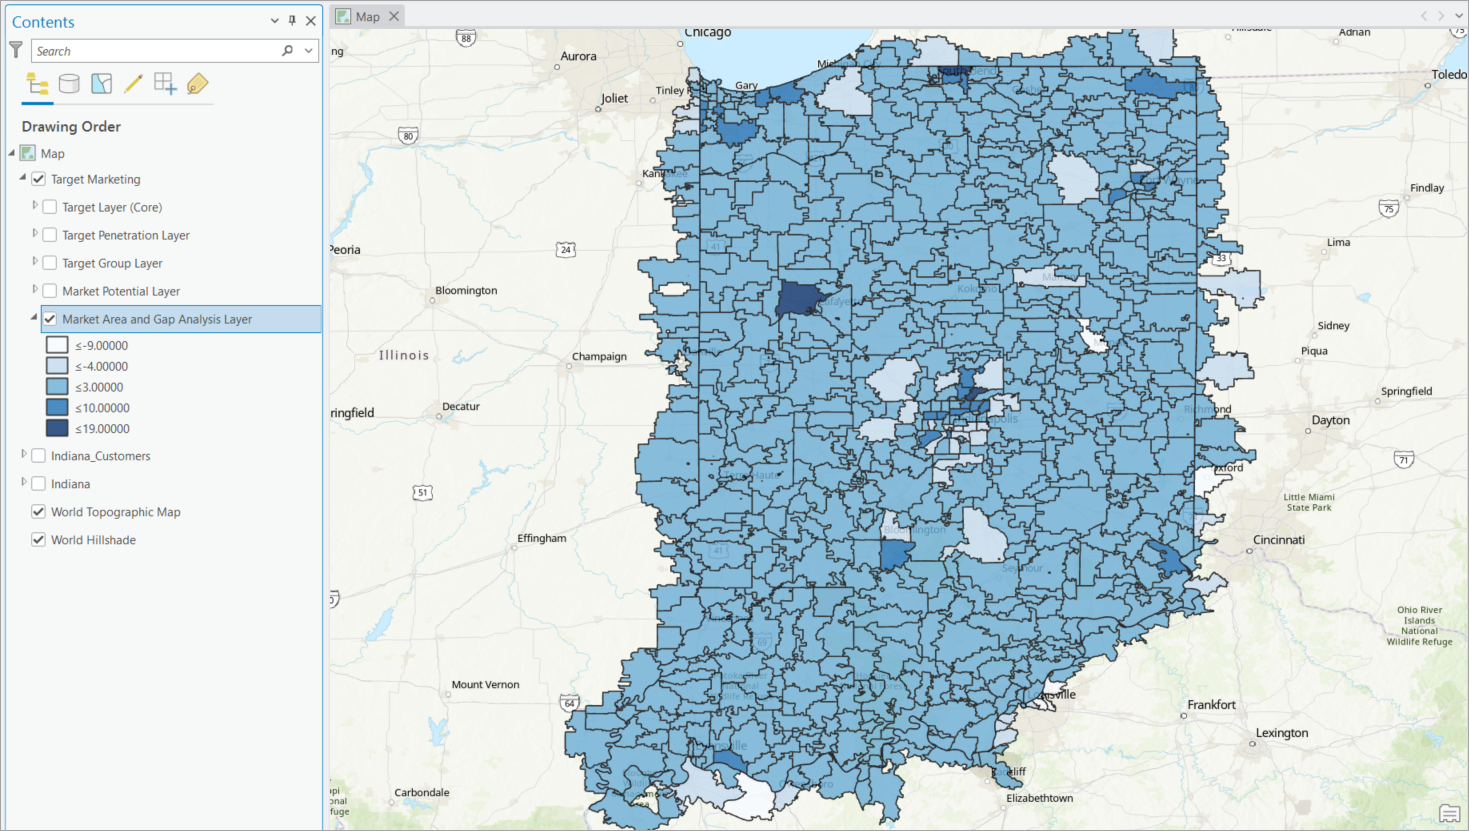
Market Area and Gap Analysis Layer
This layer displays the gap between expected customers and actual customers at a selected geography level. The layer shows where you are exceeding or falling short of expectations for market penetration. A target group that identifies your Core and Developmental targets is required for the market area and gap analysis layer.
Geoprocessing tool: Analyze Market Area Gap
Reports
The Target Marketing workflow creates up to five reports that display information from the analysis.
Report outputs
The workflow generates and automatically downloads reports you opted to create: Segmentation Profile report, Developing Marketing Strategies report, Market Potential report, Market Area and Gap Analysis report, and Customer Demographic Profile report.
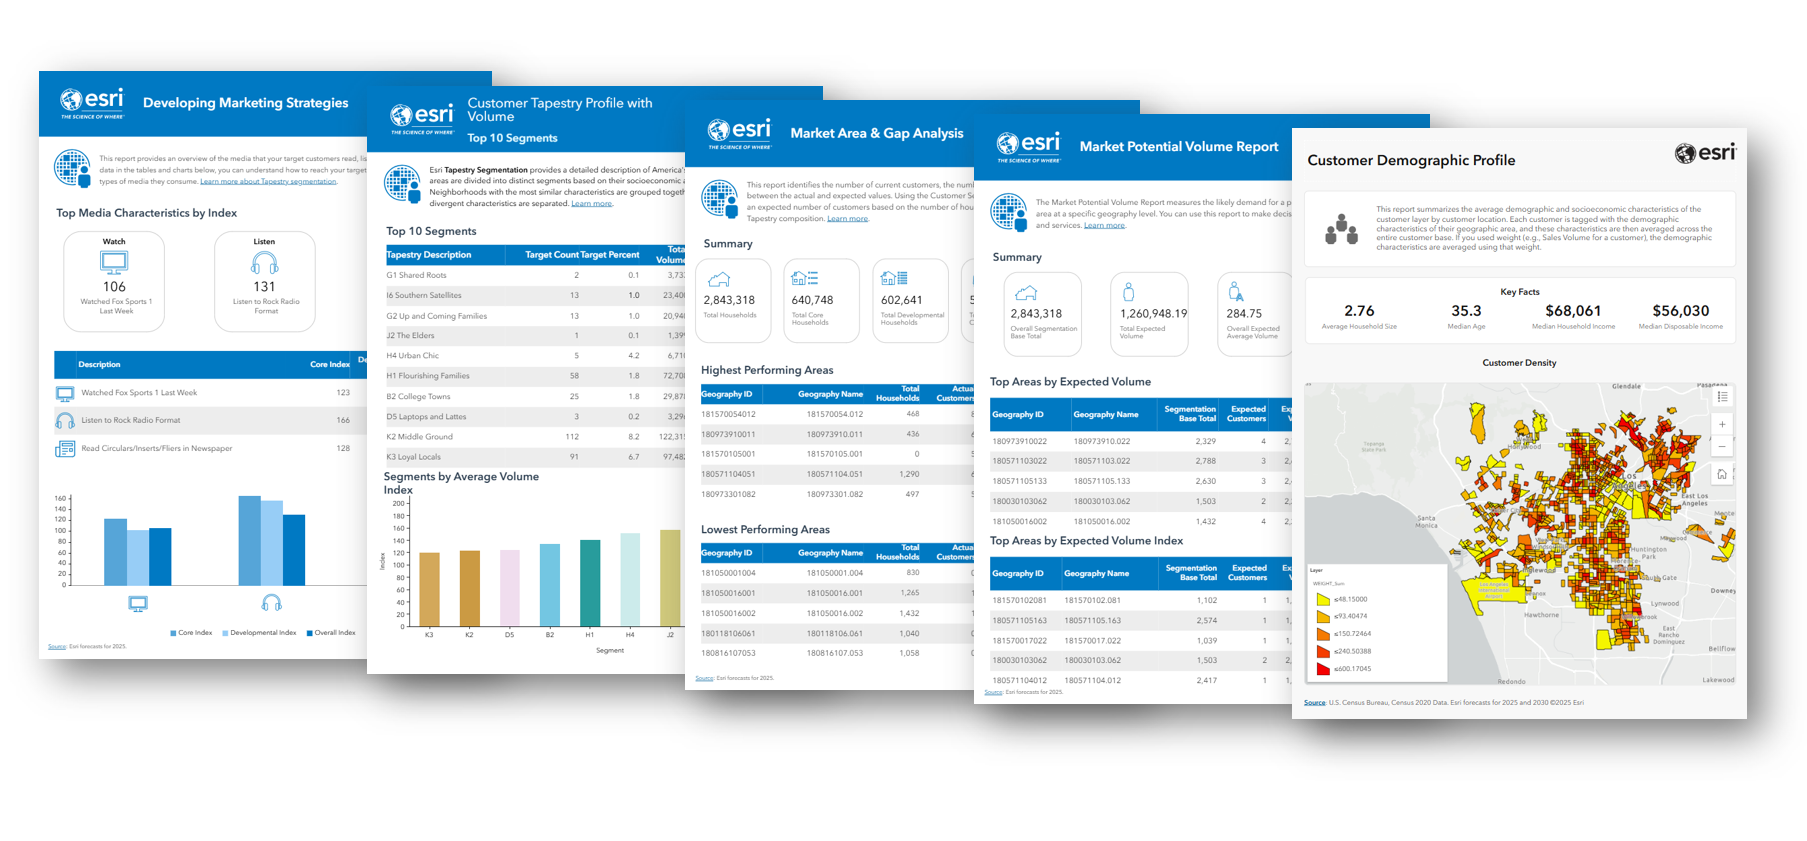
Customer Tapestry Profile report
This report helps identify your target customers. It shows the segments and summary groups that most accurately reflect your customers and compares your customer profile to the base profile of your study area using segmentation. Based on the optional volumetric parameter set during customer profile creation, this report can also be generated as a Customer Tapestry Profile with Volume report. The report is generated using the Generate Segmentation Profile Report geoprocessing tool.
- Customer Tapestry Profile report (sample)
Developing Marketing Strategies report
This report provides an overview of the media that your target customers read, listen to, and watch. It helps guide decisions about how to reach your target segment groups based on the media they consume. The target marketing wizard uses the Generate Survey Report for Targets tool to create a Developing Marketing Strategies report for your customers. You can also use the Generate Survey Report for Profile tool to create a Developing Marketing Strategies report for the general market area.
Market Potential report
This report builds on information included in the Market Potential map layer. It calculates expected customers, as well as the expected market penetration rate. The report allows you to see where you are over- and underperforming. Based on the optional volumetric parameter set during customer profile creation, this report can also be generated as a Market Potential with Volume report. The report is generated using the Analyze Market Potential geoprocessing tool.
- Market Potential report (sample)
Market Area and Gap Analysis report
This report builds on information included in the Market Area and Gap Analysis map layer. It uses the Customer Tapestry Profile you created, calculating an expected number of customers based on the number of households in a geographic unit and their Tapestry composition. The report details the gap, or the difference, between actual customers and expected customers. Based on the optional volumetric parameter set during customer profile creation, this report can also be generated as a Market Area and Gap Analysis with Volume report. The report is generated using the Analyze Market Area Gap geoprocessing tool.
- Market Area and Gap Analysis report (sample)
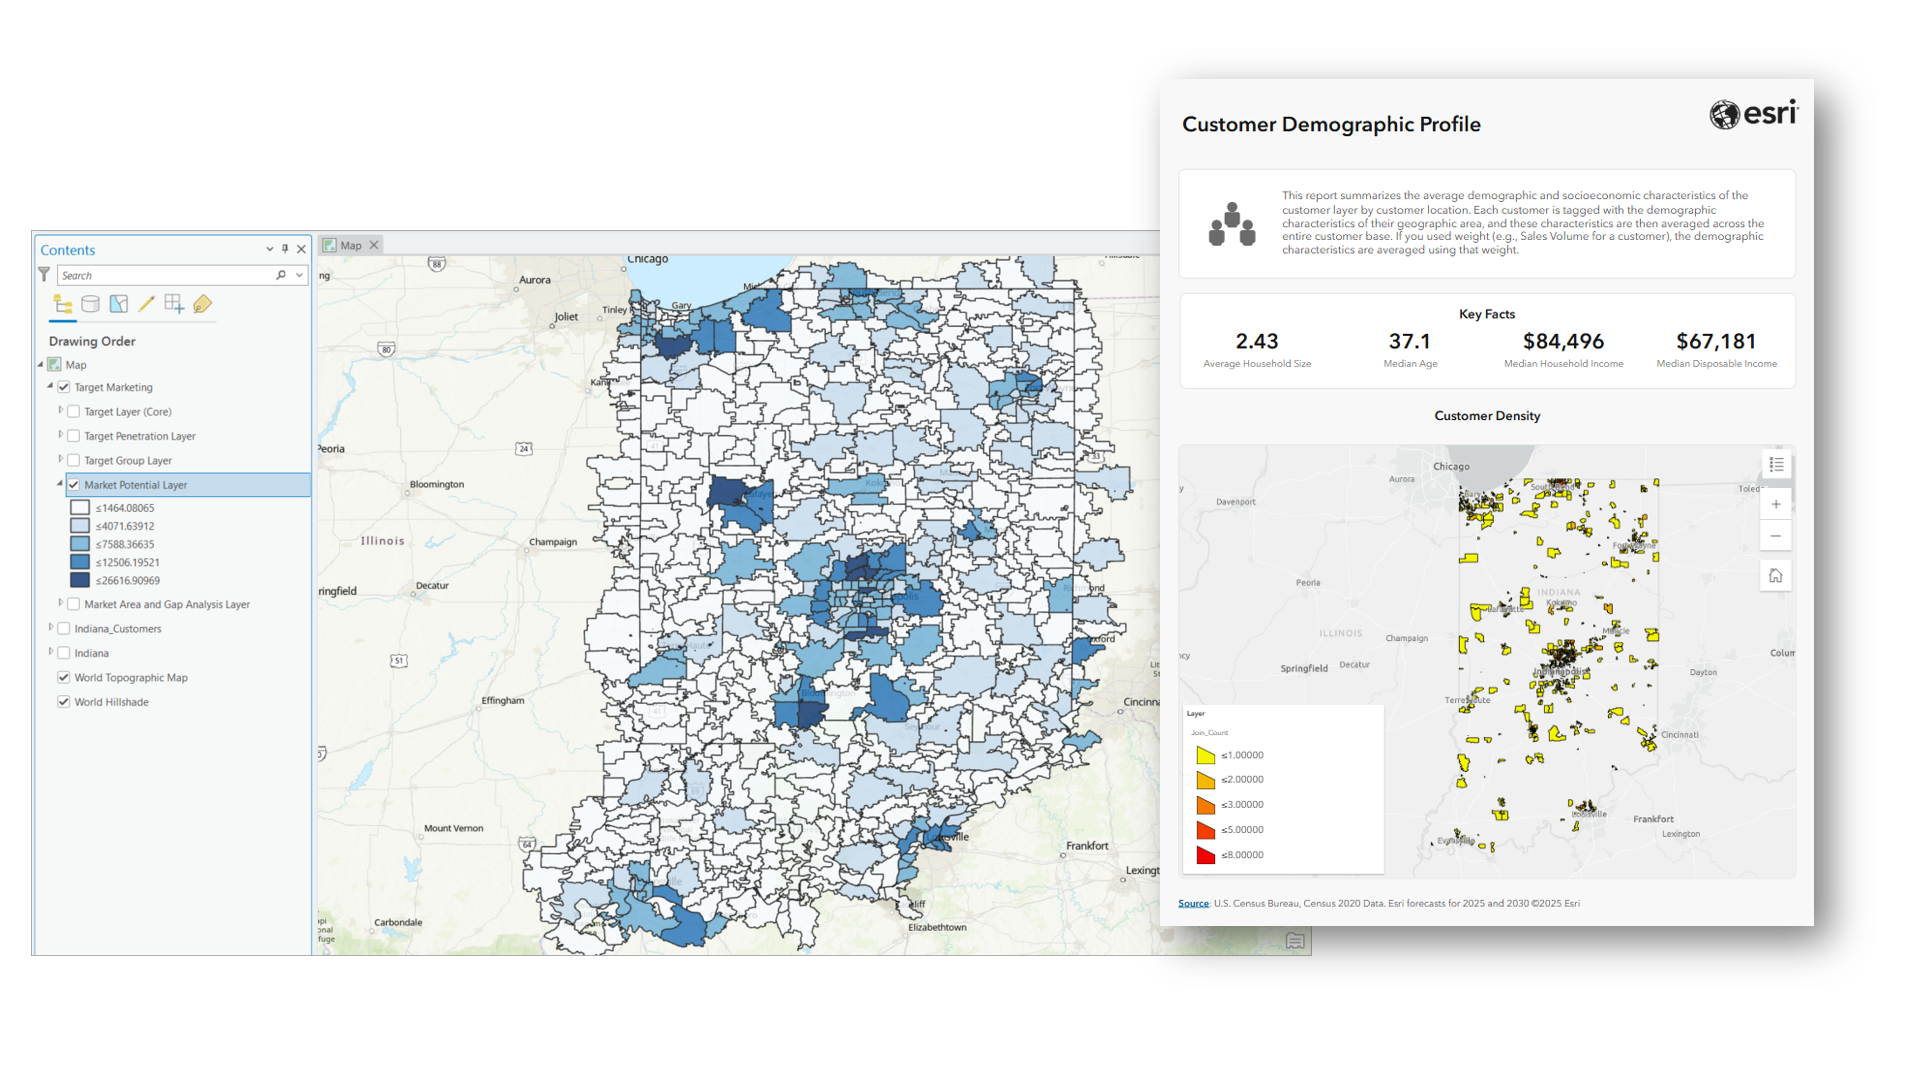
Customer Demographic Profile report
This report summarizes demographic information to understand characteristics that could be considered common among customers in an area. Customer points are summarized using underlying polygon features (block group by default) and based on the distribution of points (such as customer points), a demographic overview is created. The report is generated using the Generate Customer Demographic Profile Report geoprocessing tool.
Customer Demographic Profile report (sample)
Licensing requirements
This workflow requires a Business Analyst license in ArcGIS Pro. For more information, see Licensing.