Focal Statistics (Spatial Analyst Tools)
Summary
Calculates for each input cell location a statistic of the values within a specified neighborhood around it.
Illustration
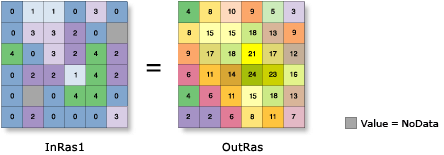
OutRas = FocalStatistics(InRas1, NbrRectangle(3,3,"CELL"), "SUM", "DATA")Usage
There are several neighborhood shapes and statistics types to choose from. The available statistics depend on the type of the input raster.
The available neighborhood shapes are annulus (a donut or ring), circle, rectangle, and wedge. A custom neighborhood shape can be defined using a kernel file.
When a circular, an annulus-shaped, or a wedge-shaped neighborhood is specified, some of the outer diagonal cells may not be considered in the calculations because the center of the cell must be encompassed within the neighborhood.
The irregular and weight Neighborhood types require that a Kernel file value be specified. A kernel file is an ASCII text file that specifies the values and shape of the neighborhood. The file can be created with any plain text editor. The file must have a
.txtextension and no spaces in the file name.See the Irregular and Weight sections of How Focal Statistics works for information about creating and using kernel files.
For integer input rasters, the valid statistics for Statistics type are majority, maximum, mean, median, minimum, minority, percentile, range, standard deviation, sum, and variety. For float input rasters, the valid statistics are maximum, mean, median, minimum, percentile, range, standard deviation, and sum. Majority, minority, and variety are not available for float input rasters.
If the input raster is integer, the output raster will be integer for the majority, maximum, minimum, minority, range, sum, and variety statistic types. The output will be float for the mean, median, percentile, and standard deviation statistic types.
If the input raster is of float type, the output will be float for all of the available statistic types.
For median calculations, if the neighborhood has an odd number of cells, the values will be ranked and the middle value will be reported as the median. If the neighborhood has an even number of cells, the values will be ranked and the middle two values will be averaged.
For majority and minority calculations, see the How Focal Statistics works topic for more information when there is a tie.
The Neighborhood parameter can be set to Weight only for the Mean, Standard deviation, and Sum statistic types.
Input NoData cells may receive a value in the output if the Ignore NoData in calculations parameter is checked, provided at least one cell within the neighborhood has a valid value.
See Analysis environments and Spatial Analyst for additional details on the geoprocessing environments that apply to this tool.
Parameters
| Label | Explanation | Data type |
|---|---|---|
|
Input raster |
The raster for which the focal statistics for each input cell will be calculated. |
Raster Layer |
|
Neighborhood (Optional) |
The cells surrounding a processing cell that will be used in the statistic calculation. There are several predefined neighborhood types to choose from, or a custom kernel can be defined. Once the neighborhood type is selected, other parameters can be set to fully define the shape, size, and units of measure. The default neighborhood is a square rectangle with a width and height of three cells. The following are the forms of the available neighborhood types:
For the annulus, circle, rectangle and wedge neighborhood types, the distance units for the parameters can be specified in Cell units or Map units. Cell units is the default. For kernel neighborhoods, the first line in the kernel file defines the width and height of the neighborhood in numbers of cells. The subsequent lines indicate how the input value that corresponds to that location in the kernel will be processed. A value of 0 in the kernel file for either the irregular or the weight neighborhood type indicates the corresponding location will not be included in the calculation. For the irregular neighborhood, a value of 1 in the kernel file indicates that the corresponding input cell will be included in the operation. For the weight neighborhood, the value at each position indicates what the corresponding input cell value is to be multiplied by. Positive, negative, and decimal values can be used. |
Neighborhood |
|
Statistics type (Optional) |
Specifies the statistic type to be calculated. The default statistic type is Mean. If the input raster is integer, all the statistics types will be available. If the input raster is floating point, only the Mean, Maximum, Median, Minimum, Percentile, Range, Standard deviation, and Sum statistic types will be available.
|
String |
|
Ignore NoData in calculations (Optional) |
Specifies whether NoData values will be ignored by the statistic calculation.
|
Boolean |
|
Percentile value (Optional) |
The percentile value that will be calculated. The default is 90, for the 90th percentile. The value can range from 0 to 100. The 0th percentile is essentially equivalent to the minimum statistic, and the 100th percentile is equivalent to the maximum statistic. A value of 50 will produce essentially the same result as the median statistic. This option is only supported if the Statistics type parameter is set to Percentile. If any other statistic type is specified, this parameter will be ignored. |
Double |
Return value
| Label | Explanation | Data type |
|---|---|---|
|
Output raster |
The output focal statistics raster. |
Raster |
Environments
Auto Commit, Cell Size, Cell Size Projection Method, Compression, Current Workspace, Extent, Geographic Transformations, Mask, Output CONFIG Keyword, Output Coordinate System, Parallel Processing Factor, Scratch Workspace, Snap Raster, Tile Size
Licensing information
- Basic: Requires Spatial Analyst or Image Analyst
- Standard: Requires Spatial Analyst or Image Analyst
- Advanced: Requires Spatial Analyst or Image Analyst