Create a project
ArcGIS Pro helps you organize and manage the resources related to your work. To do this, it uses a project file (.aprx). An ArcGIS Pro project can contain maps, scenes, layouts, and other items. It can also contain connections to data stored in folders, databases, and servers. Web maps, web layers, and other content can be added from your ArcGIS Online or ArcGIS Enterprise portal. Content you create in ArcGIS Pro can in turn be shared to your portal.
Overview
In this tutorial, you'll create an ArcGIS Pro project to identify critical habitat areas for endangered species in part of the San Bernardino National Forest in Southern California. The tutorial introduces you to operations, such as analysis and symbology, that are covered in more depth in other tutorials.
Estimated time: 45 minutes
Software requirements: ArcGIS Pro Basic
ArcGIS Online portal connection
Note:
The quick-start tutorials are updated at each software release. For the best experience, use an online help version that matches your software version.
Note:
If you are signed in to an ArcGIS Enterprise portal, you will not be able to add the web layers used in this tutorial. You can download data equivalent to the web layers from the Create a project item page on ArcGIS Online. After you download the .zip file, extract it to a convenient location on your computer. Instructions for adding these datasets to the project are provided as needed in the tutorial. In addition, your ArcGIS Enterprise account must have geocoding privileges to find places on the map.
Create a project from a default template
When you start ArcGIS Pro, the start page appears. The start page has options to open a recent project or to create a project from a template. Templates define the starting state of a project. For example, the Map template creates a project that opens with a map view.
Start ArcGIS Pro and sign in if necessary.
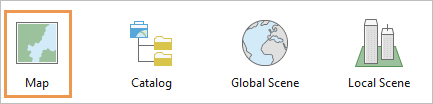
On the start page, under New Project, click Map.
Note:
If you already have a project open, click the Project tab on the ribbon. In the list of side tabs, click New. Under New Project, click Map.
On the New Project dialog box, in the Name box, replace the default project name with San Bernardino Mountains.
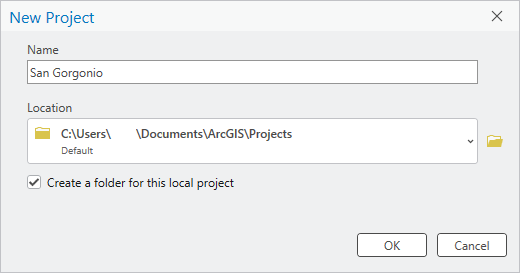
By default, projects are created in your
%USERPROFILE%\Documents\ArcGIS\Projectsfolder. To save a project to a different location, click Browse and browse to the folder you want.
The Create a folder for this local project check box is checked by default. This keeps the project file, the default default geodatabase, and the default toolbox in a single folder. You can change the default project settings in the general options for the application.
Click OK.
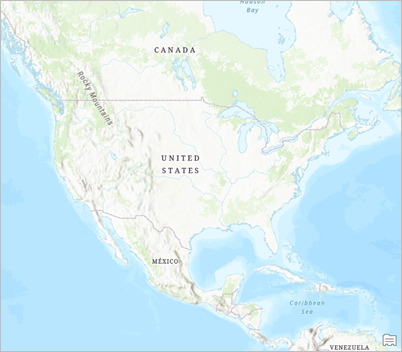
The new project opens with a map view showing a topographic basemap.
Note:
Your map may be different because the default basemap and map extent depend on administrative settings in your ArcGIS organization. You do not need to make changes to your map display.
At the top of the ArcGIS Pro window, the project name appears next to the Quick Access Toolbar.
Click the drop-down arrow next to the project name.
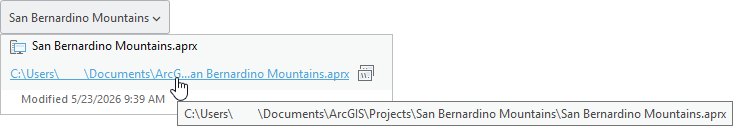
A window displays the project name, path, and time stamp of the most recent update. If the path is abbreviated, you can hover over it to see the full path. You can click the link to open File Explorer to the project location.
Tip:
You can add project metadata and a project thumbnail image on the Info page in the ArcGIS Pro settings.
Click away from the window to close it.
On the ribbon, click the View tab. In the Windows group, click Pane Sets
 and click Mapping
  .
.This ensures that the Contents and Catalog panes are open and that other panes are closed.
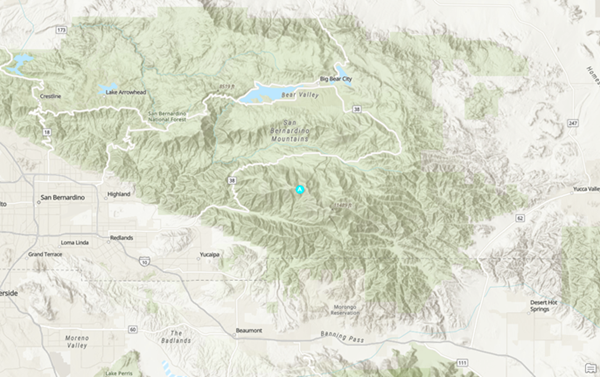
Locate the San Bernardino Mountains
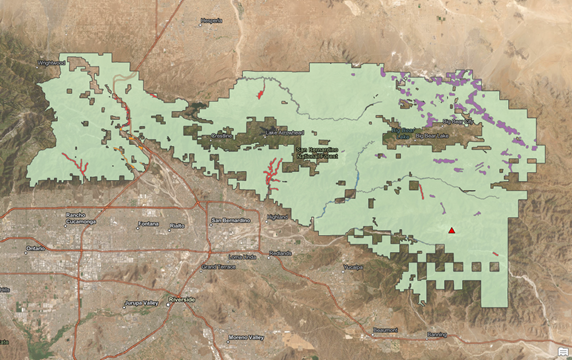
Your area of interest for this project is the San Bernardino Mountains and their surroundings.
On the ribbon, click the Map tab. In the Inquiry group, click Locate
 .
.The Locate pane appears. At the top of the pane, the Locate tab is selected by default.
In the Locate pane, in the search box, type San Bernardino Mountains. Do not press the Enter key.
As you type, a list of suggestions appears.
Click the entry for San Bernardino Mountains, CA, USA.

The map zooms in to the San Bernardino Mountains and a highlighted temporary marker is placed on the map. The location is found by the ArcGIS World Geocoding Service, one of the default locate providers (location-finding services) in ArcGIS Pro.
You'll create a spatial bookmark of this map extent so you can return to it later.
On the ribbon, on the Map tab, in the Navigate group, click Bookmarks
 and click New Bookmark
  .
.On the Create Bookmark dialog box, in the Name box, type SB Mountains. Click OK.
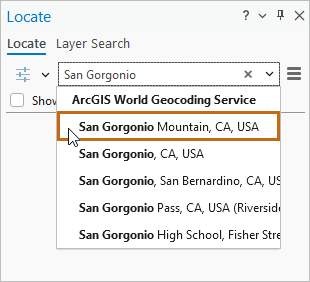
The highest peak in the San Bernardino Mountains is San Gorgonio Mountain at 11,503 feet (3,506 meters). You'll add a graphic point to the map as a landmark.
In the Locate pane, in the search box, click Delete
 to clear the search box.
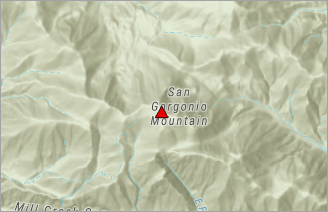
In the search box, type San Gorgonio. In the drop-down list of suggestions, click the entry for San Gorgonio Mountain, CA, USA.
The map zooms in to the location and a temporary marker is added to the map. You'll add a permanent graphic marker that will persist after you close the Locate pane.
In the Locate pane, under ArcGIS World Geocoding Service, right-click the result for San Gorgonio Mountain: California and click Add Graphic
 .
.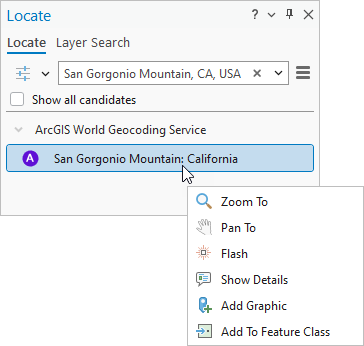
A graphic with selection handles appears on top of the temporary marker. In the Contents pane, a layer named Locate Graphics Layer is added.
Close the Locate pane.
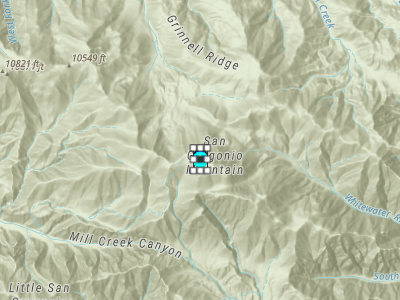
The temporary marker is removed from the map. The selected graphic remains. You'll change the default pushpin symbol.
On the ribbon, click the Graphics tab.
The Graphics tab and the Graphics Layer tab have white backgrounds to indicate that they are contextual. Contextual tabs appear on the ribbon when ArcGIS Pro is in a state that can use them. In this case, the tabs appear because there is a graphics layer in the Contents pane.
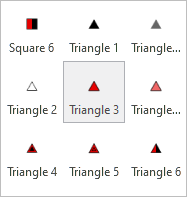
On the Graphics tab, in the Symbol group, click the More button on the symbol gallery.
Note:
Depending on the size of your application window, the symbol gallery may appear as a button in the Symbol group.
In the symbol gallery, scroll down, if necessary, and click Triangle 3.
On the Graphics tab, in the Edit group, click Clear Selection
 .
.The graphic symbol is updated on the map.
In the Contents pane, right-click Locate Graphics Layer and click Properties
 .
.The Layer Properties dialog box appears. Here you can view and modify layer settings.
If necessary, click the General tab to select it. In the Name box, delete the default name and type San Gorgonio Mountain.
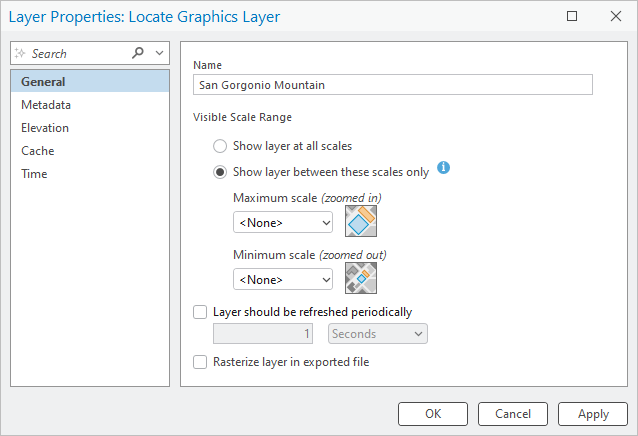
Click OK.
The layer name is updated in the Contents pane.
Note:
Map graphics are not features. They exist only on the map and have no corresponding dataset on disk. They do not have attributes and can't be used as inputs to geoprocessing tools that require feature layers. However, you can convert graphics to features with the Graphics To Features geoprocessing tool.
On the ribbon, click the Map tab. In the Navigate group, click Bookmarks
and click SB Mountains.The map zooms to the bookmark. You'll give the map a more descriptive name.
In the Contents pane, under Drawing Order, right-click Map (the default map name) and click Properties
 .
.The Map Properties dialog box appears.
If necessary, click the General tab. In the Name box, replace the name Map with San Bernardino Mountains. Click OK.
The map name is updated in the Contents pane and on the tab at the top of the map view.
On the Quick Access Toolbar, click Save Project
 .
.
Add a layer of federal lands to the map
ArcGIS Living Atlas is a collection of curated geographic data that you can use in ArcGIS Pro. If you are signed in to an ArcGIS Enterprise organization, see the note in the Overview section before you continue.
Before you add data from ArcGIS Living Atlas, you'll switch to an imagery basemap.
On the ribbon, click the Map tab if necessary. In the Layer group, click Basemap
 and click Imagery Hybrid.
The default basemap is replaced by an imagery basemap with a reference layer of place-names.
In the Layer group, click Add Data
 .
.Click the icon, not the drop-down arrow. If you accidentally click the drop-down arrow, click the Browse command
at the top of the list.On the Add Data browse dialog box, in the navigation pane, under Portal
 , click Living Atlas
  .
.At the top of the dialog box, click in the search box. Type usa federal lands and press the Enter key.
Several results are returned.
Note:
If you are using an ArcGIS Enterprise portal, do not search under Living Atlas. Instead, on the browse dialog box, under Computer >
 , click This PC and browse to the location where you extracted the downloaded data. Double-click the Create_a_project folder. Click USA Federal Lands.lyrx to select it. Click OK to add the layer to the map. Continue with step 7.
In the list of search results, click the USA Federal Lands feature layer
 to select it.
Your search results may be different, but the USA Federal Lands layer should be near the top of the list. The badges next to the USA Federal Lands layer name indicate that it is authoritative data that is included in ArcGIS Living Atlas and shared publicly. You can hover over a badge to see what it means.
Tip:
You can click Show/Hide Details Panel
 in the upper right corner of the browse dialog box to see thumbnail images and metadata for your search results. This information can help you decide whether an item meets your needs before you add it to a map.
Scroll across the list of search results to confirm that the layer owner is esri_landscapes. Click OK.

The USA_Federal_Lands layer is added to the map. In the Contents pane, federal lands are symbolized according to the agency that manages them. San Gorgonio Mountain is now only dimly visible through the partially transparent USA_Federal_Lands layer. You'll fix this later by changing the layer order in the Contents pane.
On the ribbon, on the Map tab, click Explore
 if necessary. On the map, click the large, green feature representing Forest Service land.
The Pop-up pane appears and identifies the feature as part of the San Bernardino National Forest.
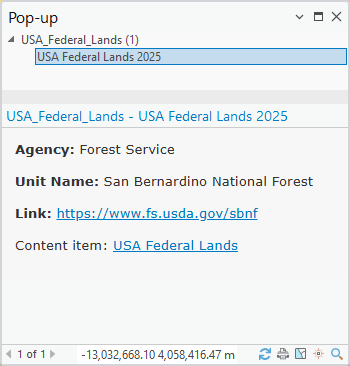
You can click the links on the pop-up to get more information.
Optionally, identify some other features in the view. Close the Pop-up pane.
Make a layer from a selected feature
You'll simplify the map by making a new layer from the Forest Service feature that covers the San Bernardino Mountains, and then removing the USA_Federal_Lands layer.
On the ribbon, on the Map tab, in the Selection group, click Select
 . Click the Forest Service feature to select it.
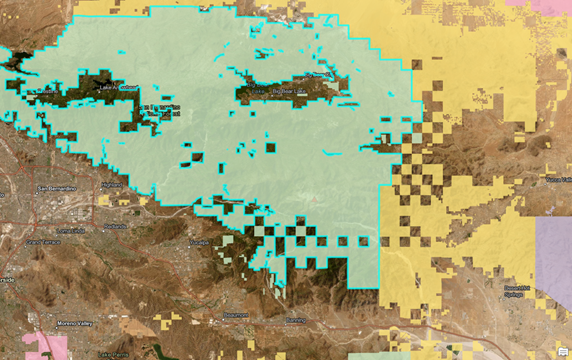
The feature is highlighted on the map.
In the Contents pane, confirm that the USA_Federal_Lands layer is selected.
On the ribbon, click the Data tab.
The Feature Layer, Labeling, and Data contextual tabs appear when a feature layer is selected in the Contents pane.
On the Data tab, in the Selection group, click Layer From Selection
 .
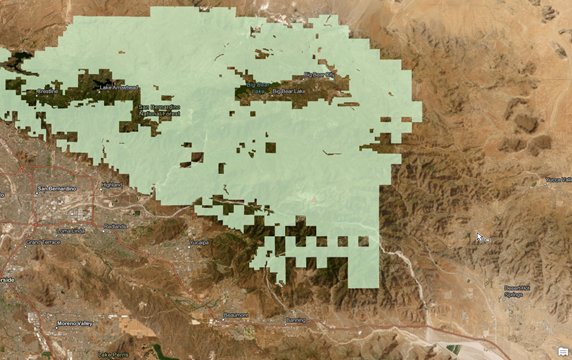
.A new layer named USA_Federal_Lands selection is added to the map and to the Contents pane. The new selection layer contains only the single Forest Service feature you selected. This will be apparent when you remove the USA_Federal_Lands layer.
In the Contents pane, click the USA_Federal_Lands layer to select it. Right-click the selected layer and click Remove
 .
.On the map, you see the single feature in the selection layer.
In the Contents pane, right-click the USA_Federal_Lands selection layer and click Properties
.On the Layer Properties dialog box, on the General tab, rename the layer San Bernardino National Forest.
Click Apply and leave the dialog box open.
On the dialog box, in the list of side tabs, click the Source tab.
Under Data Source, the Url field shows the path to the web-based data source. This is the URL of the USA_Federal_Lands layer you added from ArcGIS Living Atlas. When you make a new layer from a selection, you do not create new data—you make a different representation of the original data.
Note:
If you added the layer from your computer, the data source is a file geodatabase with a path to a local folder.
Click OK on the Layer Properties dialog box.
In the Contents pane, right-click the San Bernardino National Forest layer and click Zoom To Layer
 .
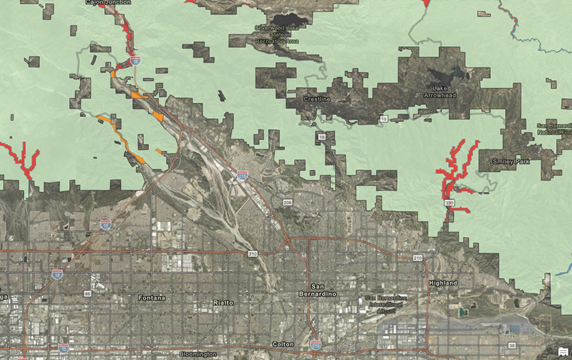
.The map zooms to the extent of the layer, which includes part of the San Gabriel Mountains as well as the San Bernardino Mountains.
On the ribbon, click the Map tab. In the Navigate group, click Bookmarks
and click New Bookmark .On the Create Bookmark dialog box, in the Name box, replace the default name with SB National Forest. Click OK.
In the Contents pane, click the San Gorgonio Mountain graphics layer to select it. Drag it to a position above the San Bernardino National Forest layer and below the Hybrid Reference layer. As you drag, the layer position is represented by a horizontal bar in the Contents pane.
The layers are reordered in the Contents pane. On the map, the mountain draws on top of the Forest Service land.

On the Quick Access Toolbar, click Save Project
.
Symbolize the national forest layer
The San Bernardino National Forest layer maintains the Unique Values symbology it inherited from the USA_Federal_Lands layer. However, this symbology method isn't appropriate for a layer with one feature. You'll save the color used to represent Forest Service land to your personal style file so you can reapply it after you change the symbology method.
In the Contents pane, right-click the symbol for Forest Service land and click Color Properties.
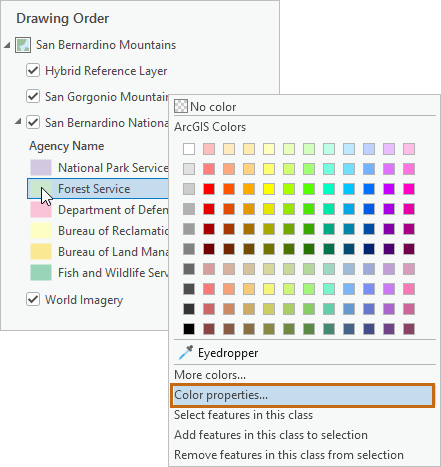
The Color Editor dialog box appears. You see the RGB and transparency values of the current color.
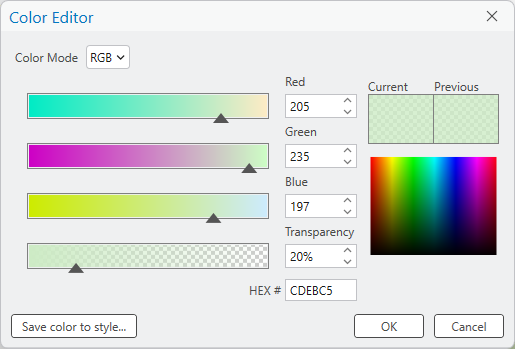
Click Save color to style.
On the Save Color As dialog box, type Forest Service Green in the Name box. Click OK.
Click OK on the Color Editor dialog box.
The color is added to your personal style file, called Favorites, which is available in every project.
In the Contents pane, right-click the San Bernardino National Forest layer and click Symbology
 .
.The Symbology pane appears.
At the top of the pane, click the Primary symbology drop-down arrow and click Single Symbol.
On the map, a randomly selected color is applied to the feature. In the Contents pane, the layer legend updates.
In the Symbology pane, right-click the default symbol to open the color palette. At the top of the color palette, under Favorites, click Forest Service Green.

The color is applied to the map and Contents pane.
On the Quick Access Toolbar, click Save Project
.Tip:
To delete the Forest Service Green color from your personal style, open a catalog view. In the Contents pane, under Project, click the Styles container
 . In the catalog view, double-click the Favorites style
  to see its contents. Right-click the Forest Service Green style item and click Delete
  .
.
Add critical habitat data to the map
A great deal of data is available from ArcGIS organizations that share their web maps and layers publicly. It is not always easy to assess the quality of public data. Data marked with the Authoritative badge ![]() is approved by Esri.
is approved by Esri.
Data does not have to be approved by Esri to be of high quality. However, before using any data—whether web based or file based—you should view its metadata. Be cautious about using datasets with no metadata or incomplete metadata.
You'll add a layer of critical habitat data hosted by an Esri-based ArcGIS organization.
On the ribbon, click the Map tab if necessary. In the Layer group, click Add Data
.On the Add Data browse dialog box, in the navigation pane, under Portal
, click ArcGIS Online  .
.In the search box at the top of the dialog box, type southern california critical habitat and press the Enter key.
Note:
If you are using an ArcGIS Enterprise portal, on the browse dialog box, under Computer
, click This PC and browse to the location where you extracted the downloaded data. Double-click the Create_a_project folder. Click SoCalCriticalHabitat.lyrx to select it and click OK. Continue with step 6.In the search results, click the Southern California Critical Habitat feature layer to select it.

Your search results may be different, but the Southern California Critical Habitat layer should be near the top of the list. Tip:
You can use the Sort
 and Filter
  buttons to order and refine long lists of search results. If you know the name of the item you are searching for, you can enclose it in quotation marks to return exact matches.
Scroll across to confirm that the layer owner is ArcGISProTutorials. Click OK.
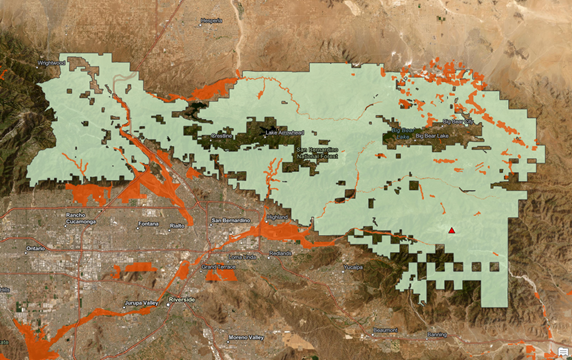
The SoCalCriticalHabitat layer is added to the map.
On the Map tab, in the Navigate group, click Explore
.On the map, click any orange critical habitat feature.
The Pop-up pane appears and identifies the feature. The pop-up includes a link to the species profile on the U.S. Fish and Wildlife Service (USFWS) website.
Identify some other features. Close the Pop-up pane.
The layer includes threatened and endangered species of amphibians, birds, fish, flowering plants, insects, and mammals.
In the Contents pane, right-click the SoCalCriticalHabitat layer and click View Metadata
 .
.A catalog view opens. Catalog views present an inventory of items in your project and can be used to manage maps, data, and other items in your project. They are also used to view and edit metadata. Metadata for the SoCalCriticalHabitat layer is displayed in the details panel of the catalog view.
Scroll through the SoCalCriticalHabitat metadata.
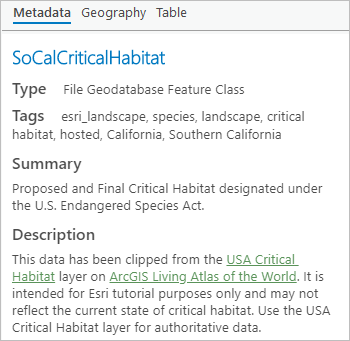
Under Description, you can see that the layer is derived from a layer hosted on ArcGIS Living Atlas. The derived layer may not represent the current state of the data, but it is suitable for this tutorial.
Close the catalog view.
In the Contents pane, click the name of the SoCalCriticalHabitat layer.
The layer name becomes editable.
Rename the layer Southern California Critical Habitat and press the Enter key.
On the Quick Access Toolbar, click Save Project
.
Clip the critical habitat layer
The critical habitat layer covers Southern California. You'll use a geoprocessing tool to clip the critical habitat features to the boundary of the San Bernardino National Forest layer. This will create a new layer in your map and a new feature class—a permanent dataset—in the default geodatabase.
When you clip the layer, habitat features that lie completely inside the national forest will be preserved. Features that cross the boundary will be split, and only the portion inside the national forest will be preserved.
On the ribbon, click the Analysis tab.
In the Tools group, several common geoprocessing tools, including Pairwise Clip, appear in the Analysis Tools gallery.
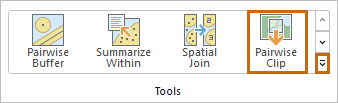
If the Analysis Tools gallery isn't wide enough to display the Pairwise Clip tool, click the More button to expand the gallery.
In the Analysis Tools gallery, click Pairwise Clip.
The tool opens in the Geoprocessing pane.
On the tool, hover over the help icon
 to see an illustrated description of the tool.
On the tool, click the Input Features drop-down arrow and click Southern California Critical Habitat.
Click the Clip Features drop-down arrow and click San Bernardino National Forest.
For Output Feature Class, delete the entire path and type SBNFCriticalHabitat (no spaces).
The path to the default geodatabase will be restored automatically.
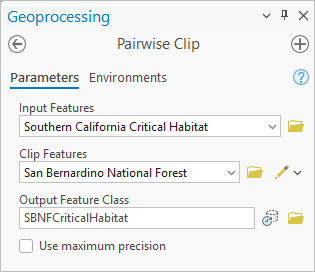
At the bottom of the pane, click Run
 .
.When the operation is complete, a message appears at the bottom of the Geoprocessing pane and a new layer is added to the map. You no longer need the Southern California Critical Habitat layer.
In the Contents pane, right-click the Southern California Critical Habitat layer and click Remove
.
The critical habitat layer is symbolized with a single symbol You'll open the layer attribute table to see which species are represented.
In the Contents pane, right-click the SBNFCriticalHabitat layer and click Attribute Table
 .
.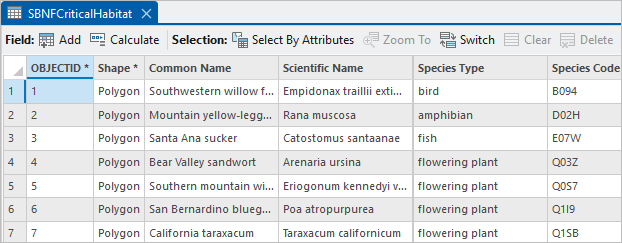
The attribute table for the layer contains fourteen rows. Each row corresponds to a map feature. Each column, or field, is a feature attribute, such as common name or species type.
Tip:
To widen a field, hover over the edge of the column heading and drag.
Close the attribute table.
Make the Catalog pane active. If your panes are stacked, click the Catalog tab
 at the bottom of the pane.
In the Catalog pane, expand the Databases container
 and expand San Bernardino Mountains.gdb.
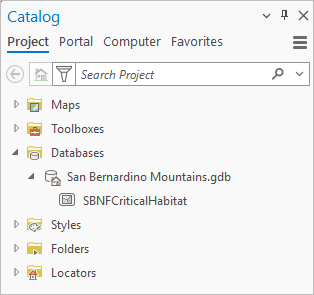
The new feature class is stored in the default geodatabase of your project.
On the Quick Access Toolbar, click Save Project
.
Symbolize the critical habitat layer
The critical habitat layer is symbolized with a single color. You'll assign a unique color to each feature according to its species type. First, you'll apply transparency to the basemap to help the foreground layer symbology stand out.
In the Contents pane, click the World Imagery layer to select it.
On the ribbon, click the Tile Layer tab.
The Tile Layer tab appears when a web tile layer is selected in the Contents pane.
In the Effects group, in the Transparency box, change the default value of 0.0% to 25 and press the Enter key.
Alternatively, click the Transparency drop-down arrow and use the slider to set a value close to 25 percent.
In the Contents pane, right-click the SBNFCriticalHabitat layer and click Symbology
to make the Symbology pane active.In the Symbology pane, under Primary Symbology, click the drop-down arrow and click Unique Values.
Click the Field 1 drop-down arrow and click Species Type as the field to symbolize.
There are five species types represented in the attribute table. Each type is assigned a different symbol.
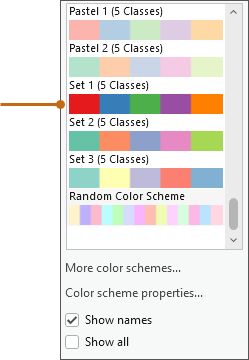
Click the Color scheme drop-down arrow. At the bottom of the drop-down list, click the Show names check box.
The name of each color scheme appears above the scheme.
Scroll to the bottom of the drop-down list and click the Set 1 (5 Classes) scheme.
The new symbology is applied to the layer.
Tip:
To see more options, click More color schemes in the Color scheme drop-down list. In the Choose a color scheme dialog box, type 5 classes in the search box.
In the lower half of the Symbology pane, on the Classes tab, click the More button and uncheck the Include all other values check box.
In the Contents pane, the gray <all other values> symbol is removed from the layer.
Note:
In a layer with many unique values, you may want to assign unique symbols to a few important features, and a generic symbol—such as a gray fill—to the rest. That is the purpose of the Include all other values symbol. However, with only a few unique values, you don't need it.
Some of the species types are hard to see on the map. This is not because of the symbology but because the features are very small or narrow.
In the Contents pane, right-click the mammal symbol class (symbolized in orange) and click Select features in this class.
The features are selected and highlighted on the map.
In the Contents pane, right-click the SBNF Critical Habitat layer, click Selection, and click Zoom To Selection
 .
.The map zooms to the extent of the selected features.
Right-click the layer again, click Selection, and click Clear Selection
 .
.
On the map, click a feature representing mammals.
The feature flashes on the map. The Pop-up pane appears and identifies the feature as San Bernardino Merriam's kangaroo rat. In fact, this is the only mammal feature in the layer. It is a multipart feature, which means that it is spatially discontinuous but represented by a single row in the layer attribute table.
Close the pop-up pane.
On the Quick Access Toolbar, click Save Project
.Optionally, try the following:
Bookmark the current location to make the kangaroo rat habitat easier to find on the map. You could do the same for the bird and fish habitat.
Change some of the symbols to brighter colors.
Choose a more neutral basemap—such as Terrain with Labels or Environment Map—to make the features in the habitat layer easier to see.
In this tutorial, you created a project and followed several common workflows: you found a location on a map, added a graphics layer, created bookmarks, added web layers, made a selection layer, used a geoprocessing tool, and changed layer symbology. For a more advanced example that incorporates some similar workflows, try the Author a map tutorial.